
Uniswap (UNI) And Curve (CRV): As DEX Volumes And Stablecoin Swaps Tick Higher, Do UNI And CRV Start A DeFi Blue‑Chip Comeback Or Stay Range‑Bound?
As we move through mid-April 2026, the decentralized finance (DeFi) sector is witnessing a subtle but persistent uptick in activity. With stablecoin transaction volumes hitting new all-time highs and on-chain swap efficiency becoming a primary focus for institutional capital, the "blue-chip" protocols—Uniswap and Curve—are back in the spotlight. However, while the fundamental "pipes" of DeFi are as busy as ever, their native tokens, UNI and CRV, are currently locked in a battle against heavy multi-month resistance.
Uniswap (UNI): Liquidity Winner, Technically Still Mid‑Range
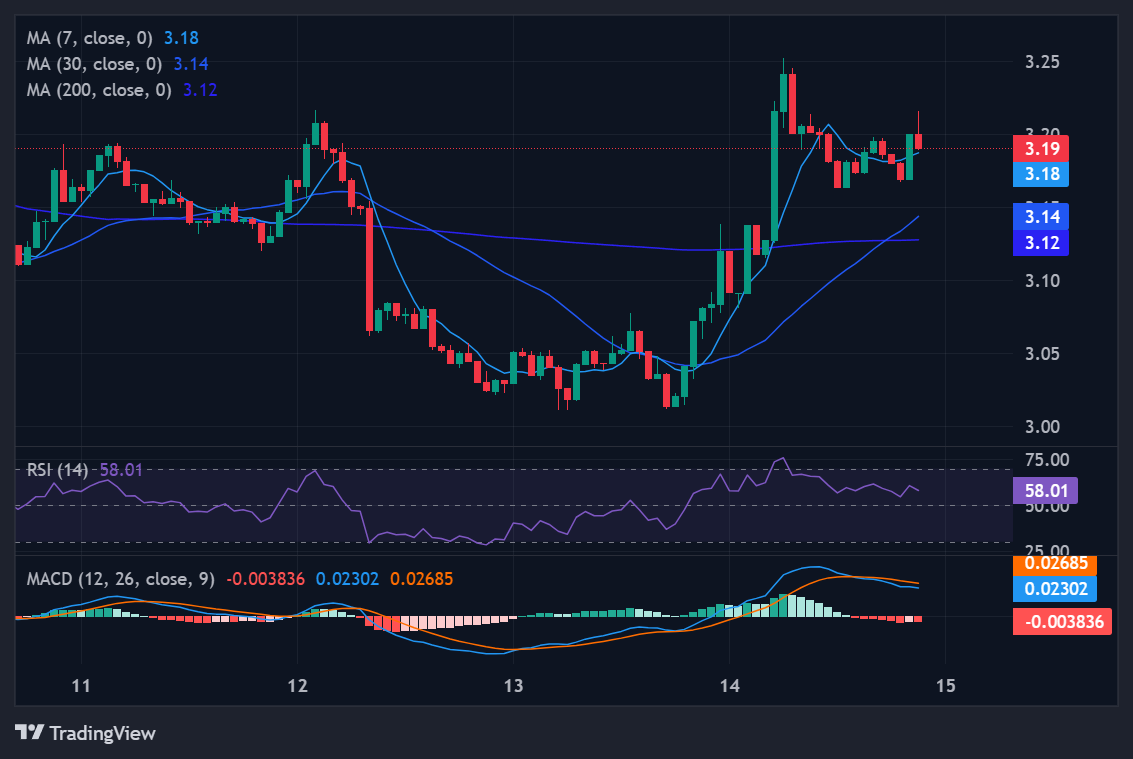
Source: tradingview
The technical picture is one of early improvement rather than a clean trend reversal. While the 7-day SMA ($3.16) is finally supporting the current price, the 30-day ($3.43) and 200-day ($5.20) moving averages remain significant overhead obstacles. The MACD histogram (+0.0057) is turning up from weak levels, but until the MACD line itself crosses into positive territory, the momentum is best described as "bottom-fishing."
TradingView Watchlist: Watch for a daily close above the $3.43 (30-day SMA) level. A sustained break here, accompanied by an RSI-14 climb into the 55–65 band, would signal that the bulls are finally wrestling control back from the sellers.
Near-Term Scenario Map
-
Base Case (-15% to +25%): UNI continues to oscillate between $2.70 and $4.00. Continued DEX volume strength keeps the floor intact, but the 200-day MA likely caps any rallies without a massive volume surge.
-
Bullish Path (+30% to +50%): A genuine DeFi comeback pushes UNI toward $4.10–$4.75. This would require a confirmed "DeFi Summer 2.0" rotation and clearly positive MACD signals.
-
Bearish Path (-20% to -30%): If capital rotates into newer narratives like AI infrastructure or RWAs, UNI may drift toward $2.50–$2.20.
Curve (CRV): Slightly Better Short‑Term Setup, Still Under Heavy Lid
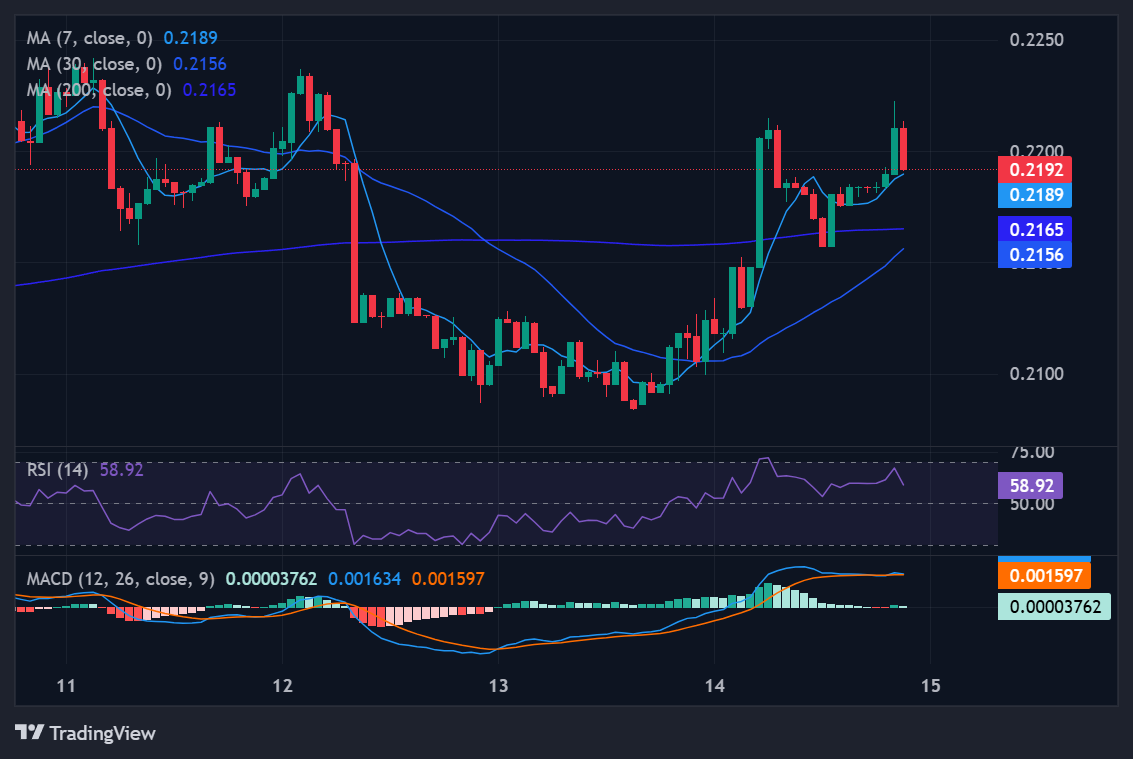
Source: tradingview
CRV’s indicators are marginally more constructive. The MACD histogram (+0.0016) is rising, and the RSI-7 (55.1) is nudging into bullish territory. While the price ($0.2169) is still under the 30-day ($0.222) and 200-day ($0.38) SMAs, the tightening of the shorter-term averages suggests a volatility expansion—likely to the upside—could be imminent if stablecoin flows persist.
Near-Term Scenario Map
-
Base Case (-15% to +30%): CRV trades in a band between $0.18 and $0.28. It likely outperforms UNI on high-volume swap days due to its tighter liquidity and specific yield-farming flows.
-
Bullish Path (+35% to +60%): A rotation led by stablecoin rails pushes CRV toward $0.29–$0.35. Breaking the 30-day MA with volume is the key trigger for this move.
-
Bearish Path (-20% to -35%): Governance concerns or shifting incentive programs could lead to a slide toward $0.17–$0.14 if the current support at $0.21 fails to hold.
Conclusion
The data confirms that both UNI and CRV are currently "survivors" rather than "leaders." Their structural trends remain bearish as they trade well under their 200-day moving averages. However, the MACD and RSI profiles suggest a tentative floor is being built.
If DEX and stablecoin activity remain at their current elevated levels through Q2 2026, we may see these blue chips re-rate by 30–50% as capital seeks the safety of established protocols. Until then, expect a wide-range grind where rallies are sold into until the long-term averages are convincingly reclaimed.
Disclaimer: This article is provided for informational purposes only. It is not offered or intended to be used as legal, tax, investment, financial, or other advice.
Investment Disclaimer