

Aptos (APT) And Sui (SUI): After New CEX Listings And Perp Pairs, Do These Move‑VM Chains Turn Speculation Into A Sustained Uptrend?
As the mid-April 2026 market unfolds, the "Move-VM" narrative—centered around the high-performance execution environments of Aptos and Sui—is receiving a fresh injection of liquidity. With a wave of new Tier-1 CEX listings and sophisticated perpetual pairs hitting the market, the infrastructure for a speculative run is officially in place. However, the tape tells a story of caution: while liquidity has improved, the technical structures remain trapped in a post-drawdown grind. Investors are now left to decide if these chains are actually turning a corner or simply providing better exits for trapped longs.
Aptos (APT): The Oversold Side Of The Trade
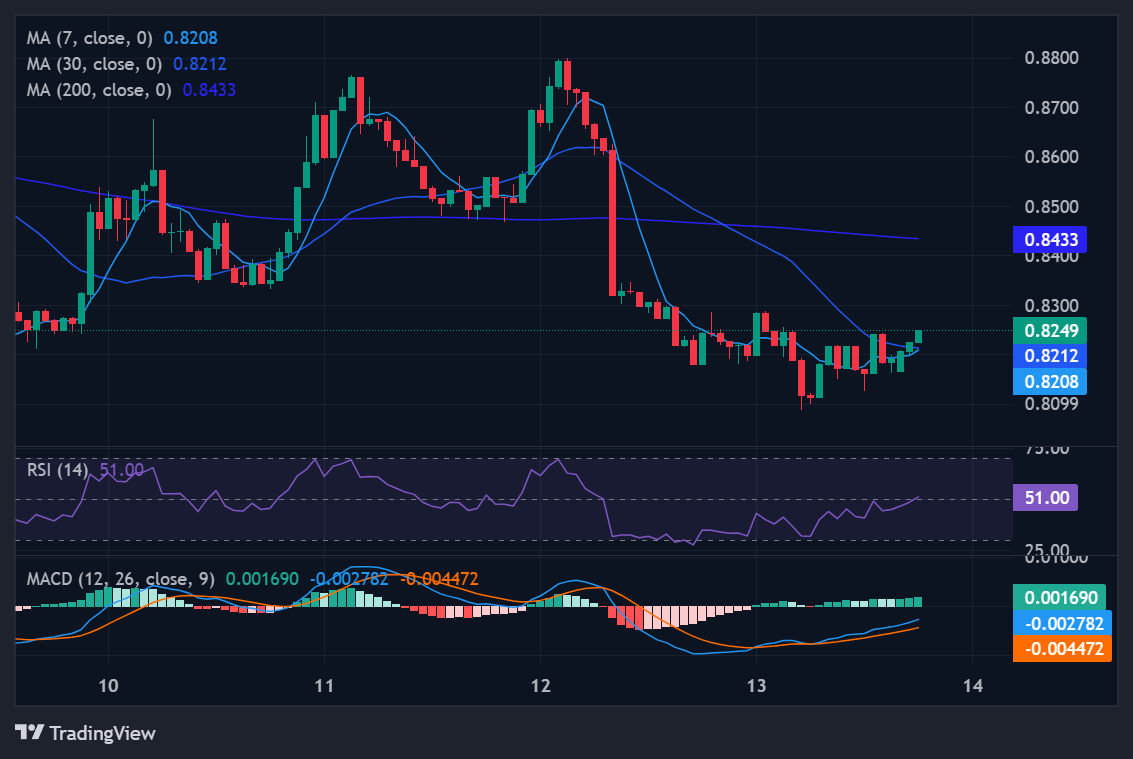
Source: tradingview
Aptos (APT) is currently the weaker sibling in the Move-VM family. Technically, APT is checking for a pulse; price action remains firmly below the 7-day ($0.84), 30-day ($0.92), and 200-day ($2.02) moving averages. While the new perp pairs have increased daily volume to ~$40M, the MACD remains negative, and an RSI-7 of 31.41 indicates an asset that is deeply oversold but lacks the "buy-the-dip" conviction needed for a reversal.
APT Price Scenarios:
-
Base Case: A weak, wide sideways grind between $0.66 and $1.03 (-20% to +25%). Bounces are likely to face heavy overhead supply from holders who have been "underwater" during the 95% drawdown.
-
Bullish Scenario: An oversold relief leg targeting $1.07–$1.24 (+30% to +50%). This requires APT to reclaim the 30-day MA and see the MACD histogram flip green, signaling a shift from a vertical fall to a recovery attempt.
-
Bearish Scenario: A continuation of the downtrend toward $0.53–$0.62 (-25% to -35%). If macro risk-off sentiment returns, APT’s fragile structure makes it vulnerable to one more leg lower.
TradingView Tip: Monitor the 30-day SMA ($0.92). Until APT can print a daily close above this level and hold it, any spike should be viewed as a "dead cat bounce" rather than a trend change.
Sui (SUI): Slightly Firmer Setup In The Same Theme
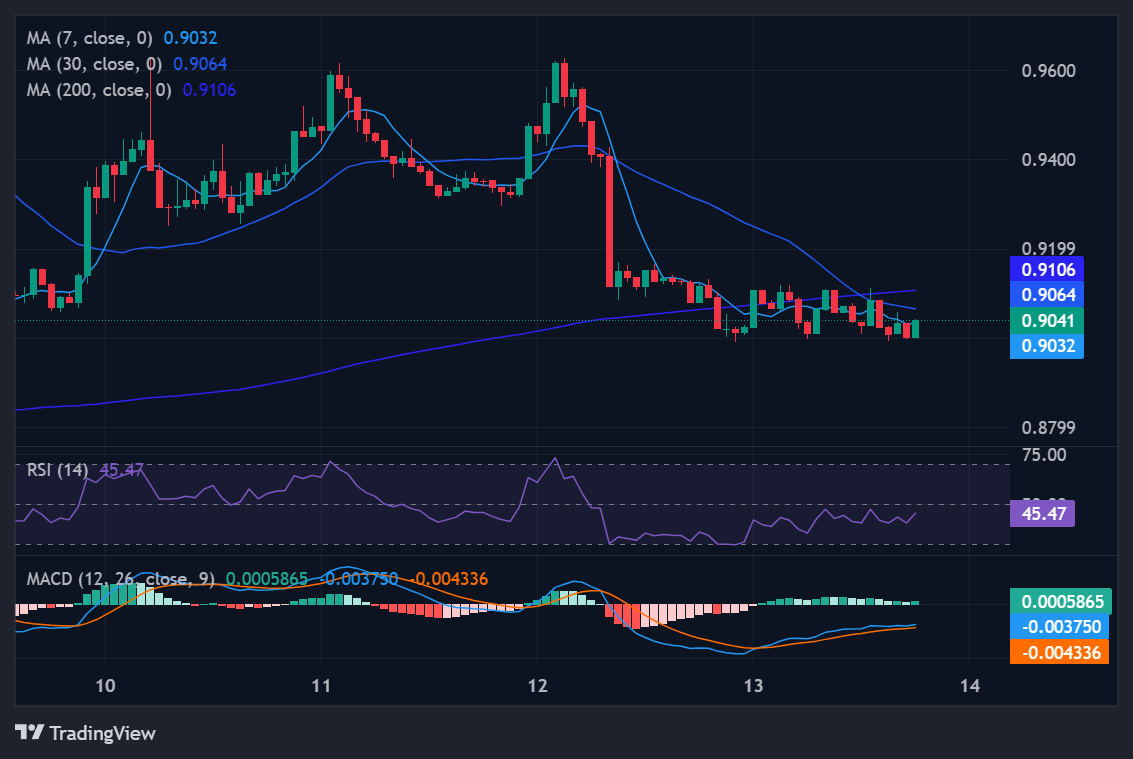
Source: tradingview
Sui (SUI) presents a more constructive—albeit still defensive—technical profile. Unlike Aptos, SUI has managed to flatten its 7-day curve (-0.09%) and its MACD histogram is actually positive (+0.007). With an RSI-14 at 47.12, SUI is in "neutral" territory, suggesting it is actively attempting to form a base. The deeper liquidity ($221M 24h volume) compared to APT makes it a more attractive vehicle for those betting on a niche "Move-VM" rotation.
SUI Price Scenarios:
-
Base Case: A constructive range between $0.72 and $1.17 (-20% to +30%). SUI is better positioned to capture speculative flows than APT, provided it holds above its recent local lows.
-
Bullish Scenario: A catch-up leg targeting $1.22–$1.45 (+35% to +60%). This would push price toward the 200-day MA ($1.63) and would be confirmed by a sustained break of the 30-day MA on expanding volume.
-
Bearish Scenario: A failed base leading to a drift toward $0.58–$0.67 (-25% to -35%). This remains a reality if the high-performance L1 narrative loses steam to more established "blue chip" sectors.
TradingView Tip: Watch the MACD line. If it crosses above the signal line while price stays above the 7-day MA, it confirms that SUI is in an early recovery phase rather than a continuation of the downtrend.
Conclusion
The arrival of new CEX listings and perp pairs has undoubtedly increased the "tradability" of Aptos and Sui. However, liquidity does not equal a trend. APT remains a high-risk, oversold play that needs to prove it can stop the bleeding. SUI has the cleaner technical case, showing early signs of momentum that could evolve into a re-rating leg if the broader market stabilizes. For now, the "Move-VM" trade is a wide, volatile range-play where the burden of proof rests entirely on the bulls to turn attention into durable capital.
Disclaimer: This article is provided for informational purposes only. It is not offered or intended to be used as legal, tax, investment, financial, or other advice.
Investment Disclaimer