

At 8:30 a.m. ET on July 30, the BEA drops the Q2 2026 GDP advance estimate. Traders will have three browser tabs open and one finger on the flatteners. It’s the print that can rewire rates expectations in a single minute. The timing is set in stone by the Bureau of Economic Analysis (BEA).
Heading in, the Atlanta Fed’s real-time model sits near a 1.5% annualized growth pace for Q2 as of July 28, a middling clip by post-pandemic standards (GDPNow). Continuum Economics is in the same ballpark with 1.4%, flagging potential drags from net exports and inventories (Continuum Economics).
Meanwhile, equities just ripped. The S&P 500 rallied roughly 14.8–14.9% in Q2, its strongest quarter since mid-2020 (Investing.com). And 10-year Treasuries are hovering near 4.65% into the print, a level that keeps duration on a short leash (FRED).
Markets don’t trade GDP in a vacuum. They trade the policy and earnings path that GDP implies. A hot number can look bullish for cyclicals but bearish for duration if it nudges the Fed toward tighter-for-longer. A soft number can do the opposite.
The reaction function is conditional: the same GDP surprise can push stocks up or down depending on what it does to rates, inflation expectations, and earnings visibility.
Why now? Because this quarter’s advance estimate arrives after a huge equity run, sticky long-end yields, and a dollar that’s been sensitive to every macro wobble. That trifecta raises the odds of an outsized cross-asset move.
What counts as a growth surprise on July 30
Advance estimate quirks
The advance estimate is built on incomplete monthly data and a fair bit of modeling. It often gets revised. That’s normal, but it also means the first read carries noise. Still, it moves markets because it anchors the quarter’s narrative until revisions land.
Two informal benchmarks matter before the release: the Atlanta Fed’s nowcast at 1.5% and independent previews like Continuum’s 1.4% citing inventory and trade risks. Prints meaningfully above that zone would be seen as hot. Below it, soft. The street’s whisper is basically that range, give or take a few tenths.
Inventories and net exports swing
Inventories and net exports love to play spoiler. A surge in inventories can goose headline GDP even if final demand is just okay. A draw can do the reverse. Net exports can move sharply on services travel and energy flows. Continuum explicitly warned about these wildcards (Continuum Economics).
- 8:30:00 — Headline GDP hits the tape. Algos key off the first line versus models like GDPNow.
- 8:30:05 — Yields jump or dump. The dollar follows in lockstep for the first 60 seconds.
- 8:30–8:31 — Equity futures react. High-duration tech is most rate sensitive. Cyclicals chase the growth angle.
- 8:31–8:35 — Desks parse the breakdown: consumption, core final sales, inventories, trade.
- By 9:00 — The second-order trade forms. Curve shape and sector rotation do the talking.
S&P 500’s setup after a monster Q2
Earnings beta to GDP
When stocks have already banked a near 15% quarter, the bar for more good news creeps higher. A stronger GDP print can read as better revenue growth prospects, but only if it doesn’t simultaneously push the discount rate higher. If 10s stay near 4.65% or climb, the multiple has to work harder (FRED).
The nuance: investors care more about final sales to private domestic purchasers than the noisy headline. If that measure is solid, quality growth names and cyclicals usually find buyers. If the beat is inventory-driven, the bounce can fade fast.
Cyclicals vs defensives
Hot growth tends to favor industrials, financials, and travel while weighing on long-duration software and some utilities if yields back up. A soft print flips that playbook, often helping bond proxies and high-duration tech. It won’t be perfect, but the tilt is consistent enough that many desks will pre-plan rotations.

Dollar playbook when growth runs hot or cold
Hot print with sticky inflation risk
If growth lands clearly above the 1.4–1.5% zone and the internals hint at re-accelerating demand, the dollar typically catches a bid. The logic is simple: stronger growth lengthens the path to rate cuts, and the dollar likes higher-for-longer. The first impulse is usually up in USD, especially against low-beta G10.
Soft print with easing bias
A downside surprise that looks broad based can knock the dollar as rate-cut odds get priced earlier, but not always. If the market sniffs a growth scare rather than a gentle slowdown, risk-off can lift the dollar anyway. It’s the classic growth-negative, dollar-positive safety move. Watch how yields move in the first minute to handicap which variant you’re in.
Bonds: duration’s headache or relief rally
Curve dynamics to watch
With the 10-year around 4.65% into the release, the pain threshold for duration isn’t far away. A hot headline backed by solid final demand probably pushes 10s higher, with the curve either bear-steepening if term premium leads or bear-flattening if front-end policy repricing dominates. A soft miss flips that script and can deliver a relief rally down the curve (FRED).
| Scenario | Stocks | Dollar | 10Y yield | 2s10s curve |
|---|---|---|---|---|
| Above nowcasts with strong final demand | Mixed to up for cyclicals, pressure on high-duration | Up initially | Up | Steepen or flatten depending on policy vs term premium |
| In line with 1.4–1.5% | Muted, focus turns to micro/earnings | Sideways | Rangebound | Little change |
| Below nowcasts, broad softness | Defensives and duration-led tech favored | Down unless risk-off dominates | Down | Bull steepen if cuts pulled forward |
| Headline boosted by inventories | Fades after first pop | Choppy | Up then retrace | Noisy |
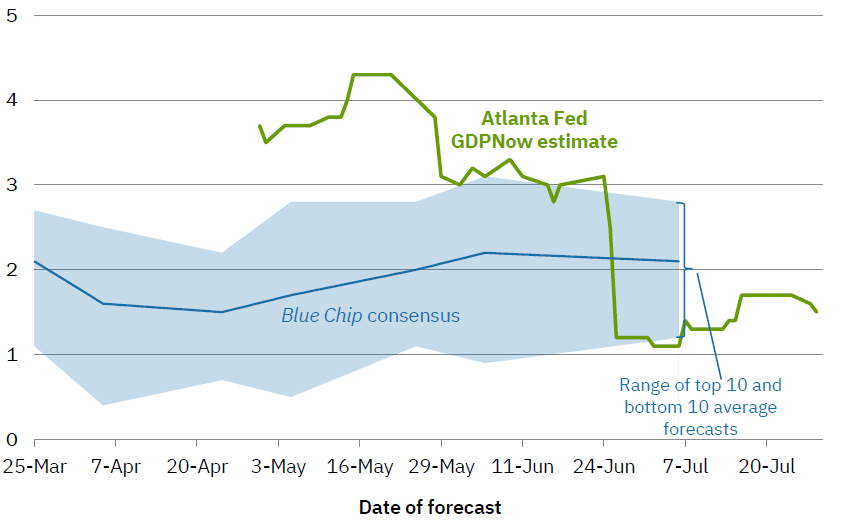
GDPNow forecast-evolution chart showing the Atlanta Fed’s Q2 nowcast (green) versus Blue Chip consensus (blue) over April–July — useful to visualize how nowcasts and consensus diverged ahead of the BEA’s July 30 advance GDP release. — Source: Federal Reserve Bank of Atlanta (GDPNow)
What to watch inside the report, fast
Consumption still carries the load
Real consumer spending is the engine. Services have been sticky; goods swing more. A steady services beat is cleaner than a one-off goods pop. If spending cools but wages hold up, the market may treat it as normalization rather than trouble.
Business investment signals durability
Look for equipment and intellectual property as tells on capex appetite. Structures can be lumpy. A solid nonresidential print says firms still see demand out there.
Housing and inventories can distort
Residential investment contributes in fits and starts. Inventories can add or subtract a full point from headline. Don’t overreact to the top line without checking this line item.
Trade math matters
Net exports often drag when domestic demand is strong. Services exports, especially travel and IP, can offset. Continuum flagged trade as a likely headwind this quarter, which could cap the headline even if domestic demand looks fine (Continuum Economics).
How to read the release in 10 minutes
- Check the headline vs the reference zone of 1.4–1.5% from GDPNow and independent previews.
- Go straight to real final sales to private domestic purchasers. That’s the clean demand read.
- Scan consumption detail. Services steady is better than a goods sugar high.
- See what inventories did. Big swings explain a lot of headline noise.
- Look at net exports. A trade drag with solid domestic demand tells one story; broad weakness tells another.
Risks & What Could Go Wrong
- Revisions: The advance print is prone to sizeable changes. A strong first read can be pared back next month.
- Deflator confusion: Markets may conflate real growth with nominal impulses. If the price side surprises, it can change the policy read.
- Inventory mirage: A headline beat driven by stockpiling tends to fade in both growth and equities.
- Algo whipsaws: First-second reactions can reverse once traders digest the internals.
- Energy prices and geopolitics can muddy the trade, especially for the dollar.
- Positioning: After a 14.8–14.9% S&P quarter, profit taking can trump the macro message (Investing.com).
Don’t confuse the first move with the real move. GDP days often reward patience and punish overconfidence.
Frequently Asked Questions
When exactly does the Q2 2026 GDP advance estimate drop?
It’s scheduled for 8:30 a.m. ET on July 30, 2026, per the official calendar from the BEA.
What’s the best baseline for a surprise this quarter?
The Atlanta Fed’s GDPNow model sat near 1.5% on July 28, and Continuum Economics flagged roughly 1.4% with inventory and trade risks. Prints meaningfully outside that zone are more likely to spark bigger moves.
Does a strong GDP number automatically lift the S&P 500?
Not automatically. Strong growth can help earnings, but if it also pushes Treasury yields up, the higher discount rate can offset the good news. Sector mix matters too. Cyclicals may rally even if high-duration names wobble.
How do Treasury yields usually react to a hot or cold print?
A hot upside surprise tends to push yields higher, especially at the 10-year, which was around 4.65% heading in. A downside miss usually does the opposite. The curve shape depends on whether the market shifts policy expectations or term premium.
What part of the report should traders check first after the headline?
Real final sales to private domestic purchasers. It strips out inventories and trade swings to show core domestic demand. After that, scan consumption details, then inventories, then net exports.
Will the dollar strengthen on a beat and weaken on a miss?
Often, but not always. A growth beat can boost the dollar via higher-for-longer rates. A growth miss can weaken the dollar unless risk-off takes over, in which case the dollar may rise on safety demand.