
• Bitzo
  • Published 1 hour ago on July 28, 2026
  • 10 Min Read

Oil Prices Fall as US-Iran Tensions Ease: What It Means for Inflation and Energy Stocks

Table of Contents

  1. Core concepts: how a cooler oil tape hits prices and stocks
  2. Mini glossary
  3. Step-by-step playbook
  4. Who gains, who hurts when crude slips
  5. Lower oil and the inflation-rate link
  6. Three paths from here: rebound, range, or slide
  7. Pitfalls and red flags
  8. Frequently Asked Questions
  9. How fast does cheaper oil show up in inflation data?
  10. Which energy stocks tend to hold up best when crude falls?
  11. Could OPEC+ reverse the drop quickly?
  12. Does a lower oil price mean rate cuts are coming?
  13. Are refiners always winners when crude falls?
  14. What should I watch to judge if this is just a risk-premium unwind?
  15. Does cheaper oil help non-energy equities too?

Oil has slipped as US-Iran tensions ease, and that small sentence carries a lot of weight. Cheaper crude filters into gasoline and diesel, touches inflation math, nudges bond yields, and tilts which energy stocks investors want to hold. It is not just a commodity headline. It is a cross-asset story.

If you are trying to figure out what to do with energy names, how this might show up in CPI, or whether the rate path shifts, this piece lays out the mechanics and the playbook. No hype. Just the moving parts and what they usually mean.

Let’s break it down in a way you can actually use this week.

Aspect What to Know
Geopolitics premium Easing US-Iran tensions reduce the fear markup in crude, taking some air out of prices without changing long-run supply capacity.
Inflation impact Lower oil cools headline inflation more than core. Pass-through to pump prices and airfares usually takes weeks, not days.
Rates and FX Softer energy can pull breakeven inflation lower and, at the margin, ease pressure on yields. A stronger dollar can offset some oil relief abroad.
Sector winners Refiners and fuel-heavy consumers often benefit first. Integrated majors hold up better than small E&Ps when crude slips.
OPEC+ response risk A quick policy change or quota discipline shift can erase the drop. Always respect the cartel calendar.
Curve and spreads Watch backwardation, time spreads, and crack spreads. They reveal tightness in products that equities trade on.
Timeline Spot moves are immediate, CPI lags. Equities react in hours, but fundamentals play out over a quarter.

Core concepts: how a cooler oil tape hits prices and stocks

When geopolitical risk recedes, a chunk of crude’s price that was there for safety can vanish quickly. That is the risk premium. You do not need a change in rigs or refineries to see a drop. It is simply the market repricing the odds of supply disruption.

Inflation feels this mostly through gasoline and diesel. Those are volatile. The Bureau of Labor Statistics weighs motor fuel inside headline CPI, and the Bureau of Economic Analysis does the same within PCE. Energy is a swing factor because it moves fast and feeds into transport, logistics, and some goods.

On equities, upstream producers have high operating leverage to crude. Integrated majors diversify that with refining and chemicals. Midstream is more about volumes than price. Refiners care about crack spreads more than spot crude direction. This is why the same oil move can mean different things across the energy complex.

The futures curve matters too. A market in backwardation tells you near-term tightness. Time spreads and product cracks often lead equity factor rotations by days or weeks.

Mini glossary

  • Risk premium: The extra price investors pay for crude to compensate for geopolitical or supply risk.
  • Crack spread: The margin a refiner earns turning crude into products like gasoline and diesel.
  • Backwardation: When near-term futures trade above later months, signaling tight prompt supply.
  • Breakeven inflation: The market-implied inflation rate from TIPS vs Treasuries.
  • Integrated oil: Companies with upstream, midstream, and downstream operations under one roof.
  • Hedging: Using futures or options to reduce exposure to price swings.

Step-by-step playbook

  1. Map the move: Separate the geopolitical give-back from fundamentals. Check the futures curve and inventory trend before changing a thesis.
  2. Watch products, not just crude: Track gasoline and diesel prices and crack spreads. Refiners and transport stocks key off these.
  3. Link to inflation data: Note CPI release dates on the BLS calendar. Expect a lag between crude’s drop and measurable CPI relief.
  4. Re-rank energy exposure: Tilt toward integrateds and refiners if crude weakness persists. Trim high-beta E&Ps with weak balance sheets.
  5. Mind OPEC+ timing: Keep an eye on policy meetings and communiques. A cut or quota extension can reverse the narrative fast.
  6. Check the dollar: A firm USD can amplify crude’s slide and cap international energy earnings translated back to dollars.
  7. Use options for asymmetry: Consider collars or put spreads on producers to guard against a deeper drawdown while keeping upside if tensions reheat.
  8. Confirm with flows: Look at ETF flows and factor performance in energy. If money is rotating to downstream, that is your signal.

Who gains, who hurts when crude slips

Not all “energy stocks” are the same. Lower oil is a headwind for some and a tailwind for others. Here is a quick map you can keep on your desk.

Segment Typical impact from falling oil Timeframe Metrics to watch
Exploration & Production (E&P) Negative on realized prices and cash flow. Hedged names hold up better. Immediate to 1 quarter Realized price vs hedge book, lifting costs, leverage
Integrated majors Mixed to slightly negative. Downstream and chemicals can offset weaker upstream. 1 to 2 quarters Refining utilization, capex discipline, dividend coverage
Refiners Often positive if crack spreads widen as crude drops faster than products. Weeks to 1 quarter Gasoline and diesel cracks, outages, seasonal demand
Midstream Neutral to mildly negative. Volume and contract mix matter more than price. 1 to 2 quarters Throughput volumes, take-or-pay contracts, coverage ratio
Oilfield services Negative if producers cut activity on price weakness. 1 to 3 quarters Rig counts, backlog, day rates
Fuel consumers (airlines, trucking) Positive as fuel costs fall, with hedging smoothing the benefit. Weeks to 2 quarters Fuel cost per ASM or mile, capacity plans, load factor
Pro tip: if you trade equities off crude, anchor on diesel cracks and refinery utilization. Diesel leads industrial demand and often front-runs the equity move.

Lower oil and the inflation-rate link

Headline inflation often cools when energy falls, but the size and timing matter. Gasoline prices adjust quickly at the pump, while diesel and jet fuel pass through to freight and fares with a lag. The net effect can shave tenths off headline CPI if the move holds into the survey period, but the core basket barely budges from oil alone.

Markets reflect that through breakeven inflation and rate expectations. A softer energy tape can ease pressure on nominal yields if it lowers the near-term inflation run rate. That is not a promise of rate cuts. The Federal Reserve still focuses on core services ex housing and the labor market. Energy is a swing factor but not the only one.

If you want to track the real economy tie-in, weekly US product supplied data in the EIA report offers a near-term pulse on demand. Declining demand with falling prices tells a different story than a clean risk-premium unwind.

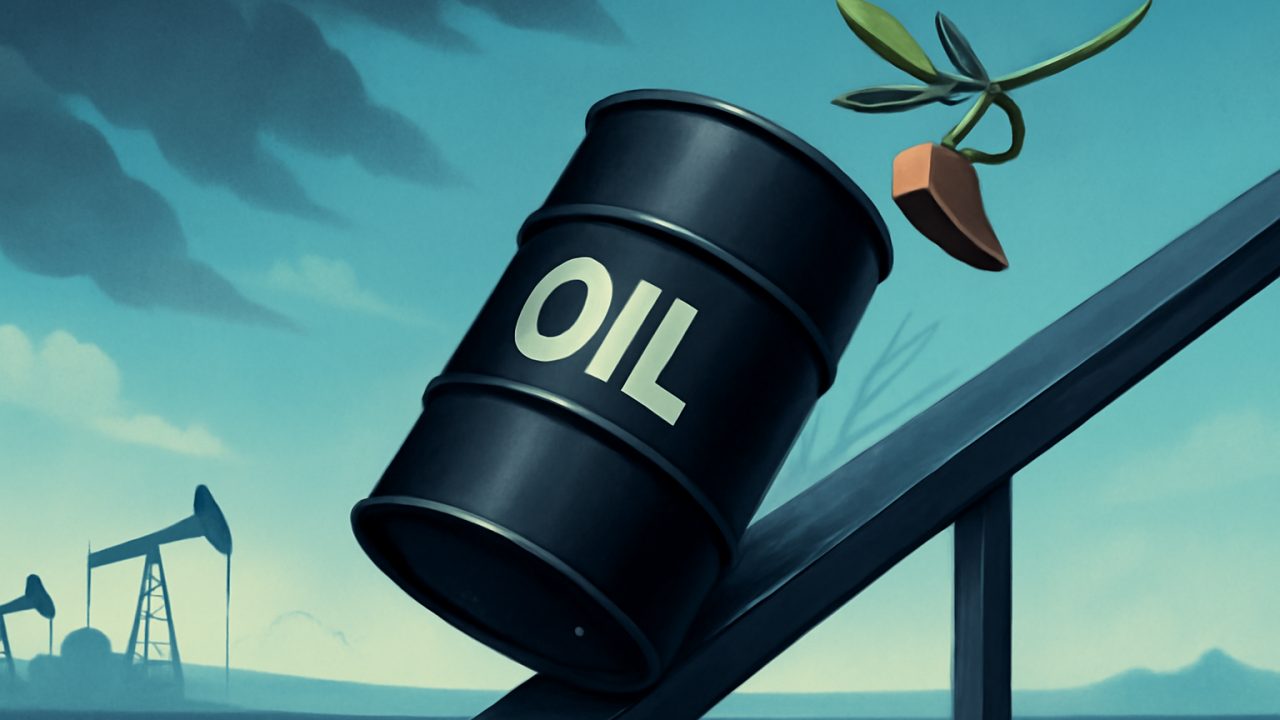
Chock Removed — Oil Barrel Starts Sliding

Three paths from here: rebound, range, or slide

It helps to sanity-check portfolios against a few simple scenarios. None of these are predictions. They are just what usually happens, and how to think about the trade-offs.

Rebound: If tensions flare back up or OPEC+ signals tighter quotas, crude can reclaim the lost premium. In that case, E&Ps and services bounce hardest, refiners stall if cracks compress, and breakevens lift.

Range trade: If the market settles into a middle band, quality and cash returns matter more than beta. Integrateds and midstream tend to outperform with steady dividends. Refiners chop around with seasonal maintenance and driving demand.

Orderly slide: If easing tensions coincide with softening demand or supply surprises, upstream takes the brunt. Refiners still need product tightness to outperform. Bond markets sniff out cooler inflation and yields drift lower, but the dollar can firm, which complicates global earnings.

Whichever path shows up, keep an eye on the curve. A flattening or flip from backwardation to contango signals looser near-term supply, which feeds directly into equity factor rotations.

Pitfalls and red flags

  • Counting on a straight line: Oil rarely trends cleanly on geopolitics alone. Inventories, seasonality, and refinery outages can overwhelm the macro story.
  • Ignoring OPEC+ calendars: Policy surprises can neutralize a geopolitical unwind in one press release.
  • Misreading CPI timing: A crude slide today does not mean next week’s CPI prints cooler. Survey windows and product lags matter.
  • Equity bucket mistake: Treating all energy stocks the same. Downstream and upstream have opposite sensitivities in a falling oil tape.
  • Hedge complacency: Producer hedge books can mask near-term damage, then roll off at bad times. Read the footnotes.
  • Overlooking the dollar: A stronger USD can dull the inflation relief and weigh on international earnings translations.

If you want a quick daily scan of macro meets digital assets, Bitzo tracks how oil, rates, and the dollar often set the tone for risk taking across markets.

Frequently Asked Questions

How fast does cheaper oil show up in inflation data?

Gasoline can change at the pump within days, but CPI and PCE read on fixed schedules and reflect average prices across a survey window. You usually see more of the effect in the next full monthly print. Core inflation barely moves with oil alone, so headline does most of the shifting.

Which energy stocks tend to hold up best when crude falls?

Integrated majors and midstream often prove more resilient due to diversification and contracted cash flows. Refiners can actually benefit if crack spreads widen. High-beta, levered E&Ps feel the most pressure because cash flow tracks realized prices closely.

Could OPEC+ reverse the drop quickly?

Yes. A statement about quotas, stronger discipline, or an unplanned cut can restore some premium. This is why traders anchor on OPEC+ meeting dates and ministerial commentary. Policy risk cuts both ways and rarely gives much advance notice.

Does a lower oil price mean rate cuts are coming?

Not by itself. Cheaper energy can cool headline inflation and take some heat off breakevens, but the Fed’s focus sits on core services, wages, and overall demand. Think of lower oil as a helpful input, not a policy decision driver.

Are refiners always winners when crude falls?

No. They benefit when product prices hold up relative to crude, which widens crack spreads. If products fall just as fast or faster, the margin lift disappears. Outages, seasonal maintenance, and regional demand can swing results.

What should I watch to judge if this is just a risk-premium unwind?

Look for stable or rising product cracks, steady or improving demand in EIA product supplied data, and inventories that are not ballooning. If the curve stays in backwardation and time spreads remain firm, the core market is still tight despite cheaper spot.

Does cheaper oil help non-energy equities too?
Often, yes. Lower fuel costs can support margins for transport, retail, and certain manufacturers, and can ease pressure on consumer wallets. If it also cools yields a bit, duration-sensitive sectors may catch a tailwind, though the dollar can complicate the global picture.

Disclaimer: This article is provided for informational purposes only. It is not offered or intended to be used as legal, tax, investment, financial, or other advice.

Investment Disclaimer

Share With Others