

Microsoft reports after the bell, and the big question is simple enough: is Azure growing fast enough to pay for the AI bill? GPUs, new data centers, power contracts... it all adds up. If Azure and the wider AI stack are scaling the way bulls hope, margins can hold up. If not, that spend starts to look heavy.
So what do we actually look for in the print and the call? A few numbers stand out. Azure growth, the new Azure AI Services run-rate, Copilot monetization signals, and any change in the capex and margin guide. Everything else hangs off those hinges.
Let’s map the moving parts so you can read the results quickly and decide whether rising AI spend still makes sense at Microsoft’s scale.
| Aspect | What to Know |
|---|---|
| Street setup | Consensus heading in expects about $4.24 EPS and roughly $87.67B in revenue for fiscal Q4 (≈ +14.7% YoY) Kiplinger. |
| Azure growth | Morgan Stanley flagged ~41% constant-currency Azure growth vs ~40.5% Visible Alpha consensus Investing.com. |
| Azure AI Services | New segment is expected to generate about $23.7B in FY2026, per S&P Global Market Intelligence/Visible Alpha S&P Global. |
| Copilot momentum | 20M paid M365 Copilot seats disclosed in Q3 (up from 15M in Q2) and a July 1 M365 price increase that could add roughly $2B to FY27 revenue Investing.com. |
| Restructuring context | About 4,800 roles cut (≈2.1%) as part of a July 6 restructuring while AI infrastructure investment continues Reuters. |
| Margin swing factors | Gross margin depends on cloud mix, AI workload intensity, and depreciation from data center build-outs; operating margin depends on opex discipline amid AI hiring and R&D. |
| What moves the stock | Azure growth vs. guide, signs of AI monetization scaling, capex trajectory, and free cash flow resilience. |
Azure is the engine. When Azure grows quickly, it throws off gross profit dollars that can fund new data centers, power upgrades, and those racks of GPUs everyone keeps talking about. But AI-heavy workloads are more compute hungry, which can dilute early margins until utilization matures and software pricing catches up.
Microsoft has started breaking out Azure AI Services as a separate disclosure line. That helps investors see what portion of cloud growth is tied directly to AI APIs, model hosting, and related services. Street models peg this new bucket at about $23.7B for FY2026 S&P Global, which is sizable enough to matter.
Then there’s Copilot. Copilot revenue mostly sits in the Productivity and Business Processes segment, not Intelligent Cloud, but it’s still part of the same flywheel. More Copilot adoption raises the average seat price and supports the overall AI monetization story. Microsoft disclosed 20M paid Copilot seats in Q3, up from 15M in Q2, and also pushed a July 1 M365 price increase that some analysts think could add around $2B to FY2027 revenue Investing.com.
On the expense side, you’ve got a company that trimmed roughly 4,800 roles in early July as part of a restructuring while still pouring billions into AI infrastructure Reuters. The signal: keep margins tight, but don’t slow the buildout.
Glossary
- Constant Currency (cc): Growth adjusted for FX swings to show underlying momentum.
- Capex: Long-lived investments in data centers, power, and hardware that hit cash flow now and depreciation later.
- Gross Margin: Revenue minus cost of revenue; in cloud, it’s driven by utilization, hardware, and power efficiency.
- Attach Rate: How often an add-on (like Copilot) sells alongside a core seat, lifting average revenue per user.
- AI Workload Mix: The share of compute tied to model training and inference; often heavier on resources early on.
- Bookings vs. Consumption: Bookings signal demand, but consumption revenue lands as customers actually use services.
Step-by-Step Playbook
- Start with the headline beats and misses. Compare reported EPS and revenue to the ~$4.24 and ~$87.67B marks the Street expected Kiplinger. Note year-over-year growth and how guidance stacks up.
- Zoom in on Azure constant-currency growth. The market is keyed to ~40–41% cc for Q4 per sell-side chatter Investing.com. A point or two either side can swing sentiment.
- Check the Azure AI Services run-rate. Look for numbers or color against the ~$23.7B FY26 expectation S&P Global. Does management cite rising utilization or broader customer adoption?
- Track Copilot adoption and pricing lift. Any update on paid seats, attach rates, or early price elasticity after the July 1 M365 increase helps size the FY27 tailwind Investing.com.
- Scrutinize capex and AI infrastructure plans. Note capital intensity, data center footprint, and GPU commitments. Watch for timelines on when new capacity turns accretive to margins.
- Read the margin bridge carefully. Separate gross margin headwinds (power, depreciation) from operating expense trends (R&D, sales). Ask how AI mix evolves and when software margins offset infra drag.
- Follow the cash. Free cash flow, working capital, and buyback cadence matter. A robust FCF print validates that growth is paying for the build.
- Map your scenarios. If Azure tops 41% cc with steady capex guide, that’s one outcome. If growth cools and capex rises, that’s another. Decide in advance how you’ll react.
When Is Azure Growth “Enough”?
There isn’t a single magic number, but there’s a logic you can use. Think of it as a triangle: Azure growth, AI monetization per unit of compute, and capex intensity. If Azure is compounding around the low 40s in constant currency, Azure AI Services is scaling toward the Street’s targets, and Copilot is adding seat-price lift, Microsoft can afford to push hard on infrastructure and still protect operating margin within a reasonable band.
If, instead, Azure growth cools into the high 30s and AI workloads skew more inferencing-heavy without enough premium pricing, the math gets harder. Depreciation ramps regardless, and power costs rarely cooperate. In that case, you need clear proof that utilization will improve over the next few quarters to keep the margin story intact.
Pro tip: on the call, translate any capacity or GPU commentary into time-to-utilization. The sooner racks light up, the faster gross margin recovers from the build phase.
Finally, keep an eye on discipline. The July workforce reduction of about 4,800 roles is a reminder that Microsoft is still carving out room for AI investment in the P&L Reuters. If opex stays controlled while AI revenue lines build, that’s the ideal shape.

How Microsoft Compares to AWS and Google Cloud
Investors inevitably stack Microsoft against Amazon and Google after prints. You’re not trying to pick a winner in one quarter; you’re trying to see who can turn AI demand into profitable, repeatable revenue with the least capex pain. Here’s a quick framework to compare apples to apples.
| Dimension | Microsoft (Azure) | AWS | Google Cloud |
|---|---|---|---|
| AI productization | Azure AI Services, OpenAI integrations, Copilot across M365 and developer tools | Foundational models and Bedrock ecosystem, strong enterprise migration tooling | Vertex AI platform, strong data/ML tooling integrated with Workspace |
| Monetization levers | Seat-based Copilot uplift plus consumption from AI APIs and model hosting | Consumption-led pricing, marketplace attach, custom silicon paths | Consumption pricing, ML services, and analytics cross-sell |
| Capex commentary | Heavy buildout for GPUs and power; focus on utilization timelines | Similar build; watch custom chips and efficiency narratives | Investing in data center scale; watch margin inflection speed |
| Reported AI metrics | Azure AI Services disclosure; Copilot paid seats updates | AI contribution often blended into services; selective metrics | AI features highlighted in Cloud disclosures; selective metrics |
| Margin trajectory | Near-term gross margin pressure offset by software mix if adoption holds | Scale benefits and optimization tailwinds; watch mix shift | Profitability focus since 2023; sensitivity to growth cadence |
What matters is not just who’s growing, but who’s monetizing AI in a way that improves unit economics over time. For Microsoft, that’s the combination of Azure AI consumption and Copilot seat uplift. If both step up together, the model gets sturdier.
Three Paths for Tonight’s Print
Let’s keep it practical. You don’t need twelve scenarios, just three that capture the main paths.
- Bull case: Azure at or above 41% cc, Azure AI Services trending well against the ~$23.7B FY26 lens, strong Copilot attach, steady capex guide, and a clean gross margin line. This says the flywheel is working.
- Base case: Azure ~40–41% cc, mixed signals on AI monetization, capex still heavy but with clear utilization milestones, and stable operating margin. This keeps the story intact but not euphoric.
- Bear case: Azure sub-39% cc, light AI commentary, higher capex guide or fuzzier timing on utilization, and visible gross margin pressure. This forces the Street to lower out-year margin assumptions.
The kicker is guidance. If management nudges growth higher and leaves capex roughly where it was, that’s supportive. If they hike capex without the growth to cover it, the market usually punishes the stock in the short run, even if the long-term thesis is unchanged.
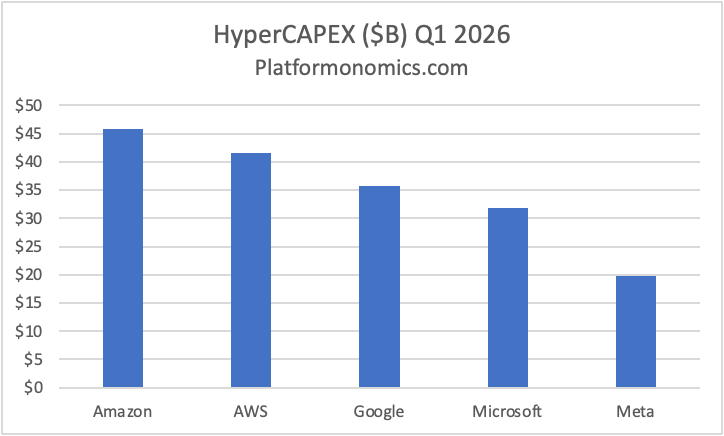
Bar chart of Q1 2026 hyperscaler CAPEX (Amazon, Google, Microsoft, Meta) showing Microsoft among the largest AI-related data‑center spenders — useful to visualize the scale of capex pressure behind Azure/AI investments. — Source: Platformonomics
Pitfalls & Red Flags
- All AI, no utilization: Big talk about capacity without timelines for lighting it up is a warning sign for near-term margins.
- Soft Azure growth vs. cc comps: A slowdown relative to the ~40% bar gets noticed fast and can pressure the multiple.
- Capex guide creep: Rising spend without clarity on efficiency gains or pricing power can compress free cash flow.
- Copilot stalling: If paid seats or attach rates flatten, the software margin offset weakens just as depreciation ramps.
- Opaque disclosures: Limited detail on Azure AI Services or power constraints leaves too much to guesswork.
- One-off boosts: Temporary items flattering EPS or margins won’t solve the structural AI cost curve.
If you want more context across markets and digital assets, we track the ripple effects of Big Tech AI spend on chips, cloud, and even on-chain analytics at Bitzo.
Frequently Asked Questions
What Azure number matters most tonight?
Constant-currency growth. The market has gravitated to roughly 40–41% as the line in the sand this quarter, based on recent preview notes Investing.com. A clean beat helps justify heavy AI investment.
How does Azure AI Services change the story?
It offers a clearer look at AI-specific demand and monetization within Azure. Street models point to around $23.7B in FY2026 for this bucket S&P Global. The more this line scales, the easier it is to support the infrastructure build.
Where does Copilot revenue show up?
Mostly in Productivity and Business Processes. Even so, it’s core to AI monetization. Microsoft cited 20M paid Copilot seats in Q3 and implemented a July 1 M365 price increase, which some expect to add about $2B to FY27 revenue Investing.com.
Why are investors hung up on capex and power?
Training and inference capacity require expensive hardware and reliable power, and those costs hit cash flow before the revenue fully catches up. The debate is about how quickly utilization and pricing can offset that drag.
What’s the quick test for “is AI spend justified”?
Pair Azure cc growth with clear AI monetization signals. If growth is healthy and AI revenue lines are scaling, margins can absorb the build. If growth softens while spend rises, expect tougher questions.
Do the recent job cuts change the thesis?
They show discipline more than anything else. Microsoft cut roughly 4,800 roles while continuing to invest in AI infrastructure Reuters. It’s a signal that cost control and AI build-out can coexist.
What would surprise the market most?
A strong Azure beat paired with a lower-than-feared capex guide, or unexpectedly detailed AI monetization disclosures that pull forward confidence in margins. Either could shift sentiment quickly.