
Solana (SOL) And Arbitrum (ARB): As Solana Perps And Arbitrum Points Campaigns Both Restart, Do SOL And ARB Split Trader Attention Or Form The Core “High‑Speed + Rollup” Beta Pair For Summer?
Traders are hunting for the definitive beta pairs of the summer. The "monolithic vs. modular" infrastructure debate is now playing out directly on the price charts. On one side, Solana (SOL) is attempting to digest a massive run while maintaining elevated perpetual trading volumes on newer native venues like Bulktrade and Flash Trade. On the other, Arbitrum (ARB) is leaning heavily on aggressive new incentive programs, such as the Arbitrum Everywhere initiative and the $415K London Buildathon, to bootstrap on-chain businesses.
However, technical structures reveal that both assets are currently caught in tradable, mid-range corrections. The ultimate success of Arbitrum's upcoming points campaigns will heavily depend on sophisticated community growth strategies—specifically leveraging targeted Reddit marketing and capturing trending slots on CoinMarketCap to generate sticky retail mindshare. Will these campaigns and high-speed trading flows be enough to form the core "High-Speed + Rollup" beta pair for the summer, or will SOL and ARB continue to split fragmented trader attention?
Solana (SOL): High‑Speed Leg In Mid‑Range Pullback
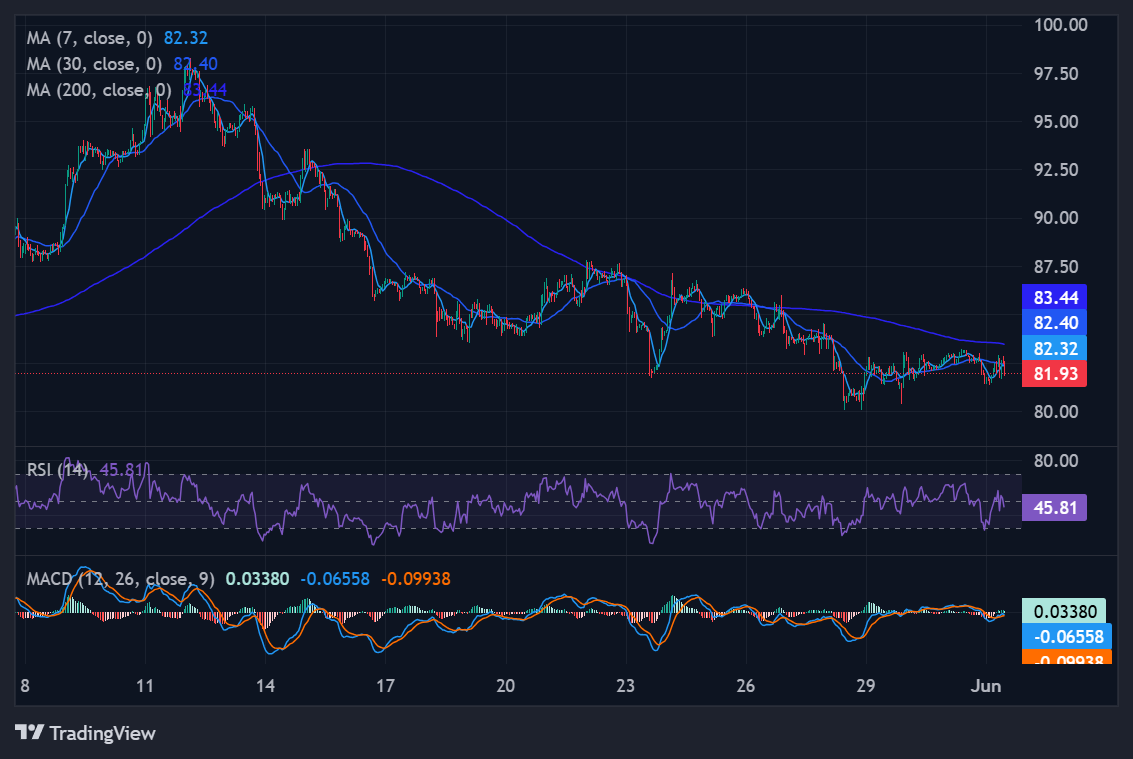
Source: tradingview
Solana is currently exhibiting a clean "post-run correction" profile. Trading just below its 30-day Simple Moving Average (SMA) but remaining safely above its 200-day baseline, SOL is digesting its recent cyclical moves.
The Structural Reality (30-Day Window):
-
Swing High: $102
-
Swing Low: $82
-
Latest Close: $90
-
Moving Averages: SMA-30 at ~$92, SMA-200 at the $80–$82 band.
Immediate Support:
-
$86 to $90: This is the first support cluster where many recent daily closes sit. Holding this band on daily closes keeps the broader $82 to $102 leg perfectly intact as a normal, healthy retracement.
-
$82 to $84: The 30-day swing low and 200-day SMA region. A daily close beneath $82 would signal that the late-spring leg is being fully unwound, setting the stage for a much deeper summer reset.
Immediate Resistance:
-
$92 to $96: The critical overhead barrier. The 30-day SMA (~$92) sits here, and repeated intraday rejections near $94–$96 are common when the tape is still correcting. SOL must reclaim and hold this band to prove it is ready to lead the high-speed sector again.
-
$100 to $102+: The local high region. Sustained closes above $102 typically align with strong perpetual and DEX volume, signaling a broad risk-on environment for the Solana ecosystem.
The Read: Right now, SOL is firmly mid-range. It is not broken, but it clearly lacks "escape velocity." For SOL to act as the high-speed half of a summer beta pair, dips must hold the $86–$90 line without testing $82 for more than brief wicks. Price needs to aggressively reclaim the $92–$96 moving average block, and the next push to $102+ must be backed by sustained derivative volumes, rather than quick wicks that immediately get faded.
Arbitrum (ARB): Rollup Beta Leaning On First Support
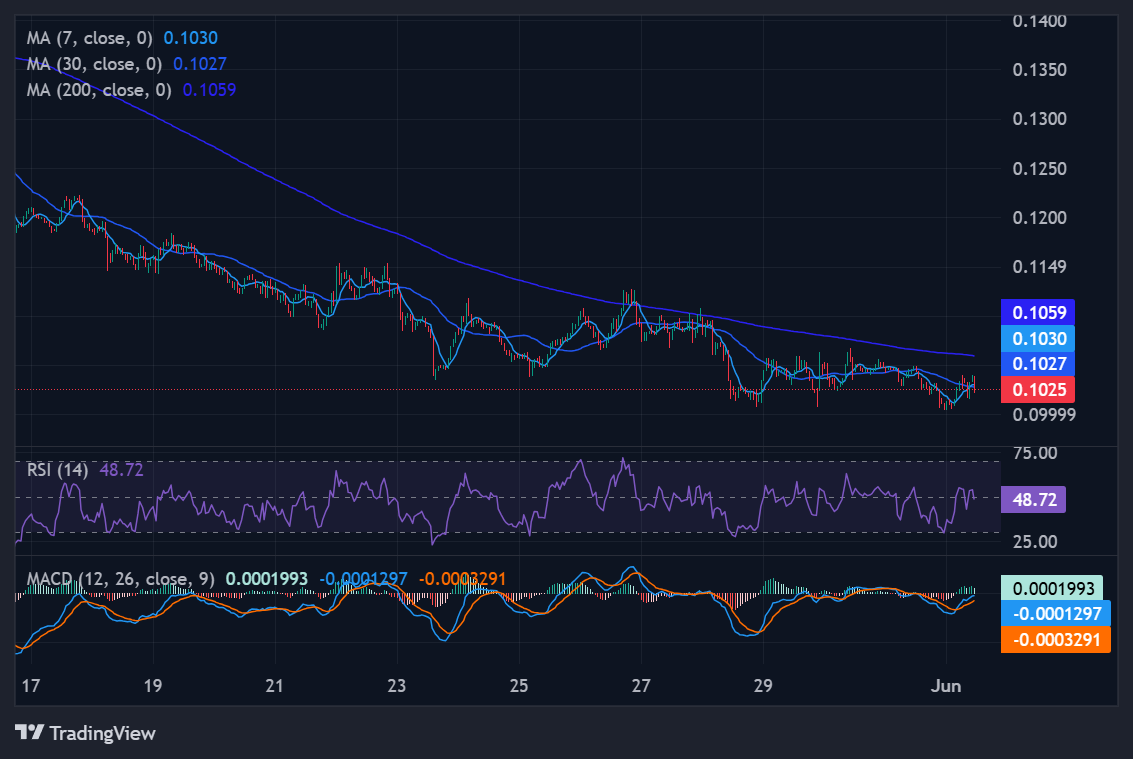
Source: tradingview
Arbitrum's chart paints a slightly weaker picture. Trading below both its 30-day SMA and its 200-day SMA, ARB is still caught in a down-biased correction and is leaning heavily on its very first line of support.
The Structural Reality (30-Day Window):
-
Swing High: $1.40
-
Swing Low: $0.95
-
Latest Close: $1.10
-
Moving Averages: SMA-30 at ~$1.18, SMA-200 at the $1.25–$1.30 band.
Immediate Support:
-
$1.00 to $1.05: This is the critical zone where recent higher lows have attempted to form. As long as ARB holds this block on daily closes, the $0.95 to $1.40 upward move is simply "cooling" rather than broken.
-
$0.95 to $0.97: The 30-day swing low. A close beneath $0.95 would confirm the entire leg is unwinding, sending a harsh signal that L2 beta remains firmly out of favor with the broader market.
Immediate Resistance:
-
$1.15 to $1.22: The primary mean-reversion band. This cluster houses the 30-day SMA (~$1.18). ARB must climb back and hold above this zone to prove that points campaigns and DeFi flows are actually being respected by buyers again.
-
$1.30 to $1.40+: The region of prior local highs. Sustained closes above $1.40 would serve as the first genuine signal of a new rollup-beta leg, likely coinciding with strong Arbitrum TVL and incentive-driven rotations.
The Read: ARB is leaning precariously on first support with all key moving averages looming overhead. To act as the rollup half of a core beta pair, it must vigorously defend the $1.00–$1.05 block and avoid spending any meaningful time under $0.95. It needs to reclaim the $1.15–$1.22 band, flattening its moving average, and rely on fresh incentive campaigns to pull TVL and volumes high enough to justify a push toward $1.40+.
Conclusion: Split Attention Or A Core Summer Beta Pair?
The technical structures show SOL in a healthy mid-range above its long-term trend, while ARB sits lower in its channel, struggling beneath its major averages.
They Form the Core “High-Speed + Rollup” Beta Pair If:
-
SOL holds the $86–$90 floor, reclaims the $92–$96 resistance block, and spends material time testing $102+ as Solana perps and DEXs consistently show top-tier volumes.
-
ARB holds $1.00–$1.05, trades primarily above the $1.15–$1.22 mean-reversion band, and pushes toward $1.40+ in step with visible TVL growth from new network campaigns.
-
Cross-chain capital rotation definitively favors a "BTC/ETH for macro" and "SOL + ARB for beta" barbell strategy, driving capital away from scattershot bets on micro-cap L2s and alt-L1s.
They Are Just Splitting Attention If:
-
SOL remains trapped beneath $96, constantly oscillating and failing to maintain any momentum above the $100 mark.
-
ARB struggles to escape the $0.95–$1.20 band and is repeatedly faded by sellers even when positive campaign news drops.
-
Market flows remain heavily fragmented across a multitude of competing L2s (Base, Blast, zkSync, OP) and alternative virtual machine chains, preventing this specific pair from achieving concentrated dominance.
Final Verdict: The charts confirm that both assets are currently in tradable ranges with room to move in either direction. They are not yet a "locked-in summer beta pair." The way they behave around their immediate overhead moving average bands over the coming 4 to 8 weeks will reveal exactly how this summer narrative breaks.
Disclaimer: This article is provided for informational purposes only. It is not offered or intended to be used as legal, tax, investment, financial, or other advice.
Investment Disclaimer