

Aptos (APT) And Sei (SEI): As Move DeFi On APT And Order‑Book Perps On SEI Expand, Do APT And SEI Attract Sticky Trading Liquidity Or Stay High‑Beta Alternatives To ETH L2s And Solana?
As the digital asset market pushes toward the second half of 2026, alternative Layer-1 networks are attempting to carve out highly specialized niches to compete with established giants. The battle for trading volume and liquidity is fierce, and two distinct architectural approaches are currently taking the spotlight.
Aptos (APT) is doubling down on its highly secure, parallelized Move-based execution to build a resilient DeFi ecosystem. Meanwhile, Sei (SEI) has positioned itself as the definitive "order-book perps chain," optimizing its infrastructure specifically to handle high-frequency trading and deep liquidity routing. However, while their fundamental value propositions are clear, their 30-day technical structures reveal that the market is still treating them cautiously. The pivotal question for both networks is whether their specialized environments can finally capture "sticky" trading liquidity, or if they will remain rotational, high-beta alternatives to Ethereum L2s and Solana.
Aptos (APT): Move DeFi Chain Sitting On Its Floor

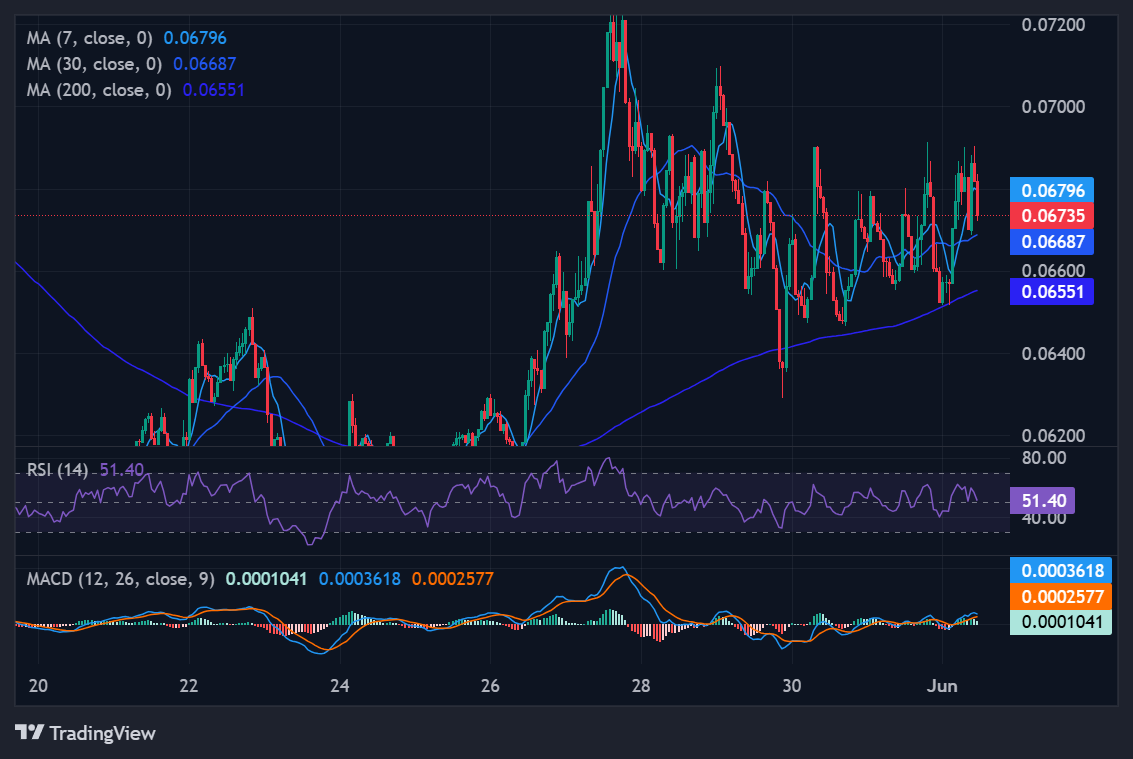
Source: tradingview
Aptos is currently exhibiting the classic behavior of a "high-beta alt-L1 in a down-leg." It is trading uncomfortably close to its local bottom, resting below both its short-term and long-term moving averages.
The Fibonacci Map ($8.50 to $12.50):
-
23.6% Retracement: $9.44
-
38.2% Retracement: $10.03
-
50.0% Retracement: $10.50
-
61.8% Retracement: $10.97
Immediate Support:
-
$8.50 to $8.80: APT is currently trading at $9.00, sitting precariously close to the $8.50 swing low. This is the absolute floor for the 30-day window. A clean daily close under $8.50 implies the market is completely repricing the prior $8.50 to $12.50 move and treating those earlier highs as a definitive top.
Immediate Resistance:
-
$9.40 to $10.00: The "first bounce" and mean-reversion band. This cluster contains the 23.6% and 38.2% Fibonacci retracements, alongside the 30-day SMA ($9.80). APT must reclaim and hold this territory just to stop looking structurally heavy.
-
$10.50 to $11.00: The critical "trend-repair zone." This block houses the 50% Fib ($10.50), the 200-day SMA ($10.50), and the 61.8% Fib ($10.97). If APT can live within and eventually conquer this band, it signals that Move-DeFi liquidity is starting to genuinely stick.
-
$12.00 to $12.50+: The local high. Sustained closes above $12.50 are required to mark the start of a brand new cyclical leg.
The Read: Right now, APT is a high-beta alt-VM hugging the bottom of its range. To attract sticky trading liquidity rather than remaining a side bet, it must rigorously defend the $8.50 floor on every dip, reclaim the $9.40–$10.00 block to pull its 30-day SMA higher, and back any serious attempt at $10.50 with rising, organic TVL on APT-native DEXes. If it fails near $10.00, it remains a rotational beta play.
Sei (SEI): Order‑Book Perps Chain In Mid‑Range, Slightly Healthier
Source: tradingview
Sei presents a slightly healthier technical picture than Aptos in this current snapshot. While it is trading slightly below its 30-day SMA ($0.55), it remains comfortably above its longer-term 200-day baseline ($0.48), placing it in a standard mid-range consolidation pattern.
The Fibonacci Map ($0.40 to $0.70):
-
23.6% Retracement: $0.47
-
38.2% Retracement: $0.51
-
50.0% Retracement: $0.55
-
61.8% Retracement: $0.59
Immediate Support:
-
$0.47 to $0.52: SEI is currently trading at $0.52, resting perfectly on this crucial "trend support band" spanning the 23.6% and 38.2% retracements. Closes above this cluster indicate that the broader $0.40 to $0.70 run remains structurally alive.
-
$0.40 to $0.42: The 30-day swing low. A daily close below $0.40 unwinds the entire leg and serves as a stark signal that order-book perp flows are not currently strong enough to support the network's valuation premium.
Immediate Resistance:
-
$0.55 to $0.59: The primary overhead hurdle. This zone clusters the 50% Fib ($0.55), the 30-day SMA ($0.55), and the 61.8% Fib ($0.59). SEI needs to reclaim and hold above this ceiling to look like it is doing more than just bouncing. In any bullish "sticky liquidity" scenario, this band must be converted into a solid base.
-
$0.65 to $0.70+: The local high region. Sustained closes above $0.70 on strong perpetual and spot volume would be the first definitive evidence of SEI breaking out of the "new alt-L1" category and into "serious trading venue" territory.
The Read: SEI is mid-range, sitting above its trend support and long-term mean, but it still requires a definitive push. To shed its status as merely a high-beta alternative to Arbitrum or Solana, it must defend $0.47, push into the $0.55–$0.59 resistance block, and consistently post competitive order-book depth. If it gets aggressively sold near $0.60, it remains just a "good alt-L1 perps playground."
Conclusion: Sticky Liquidity Or Side Bets?
The side-by-side structures reveal one asset dangerously close to losing its current structure and another waiting mid-range for directional confirmation.
They Attract Sticky Liquidity If:
-
APT holds the $8.50 floor, trades consistently above the $9.50–$10.00 mean-reversion band, and demonstrates that Move-native TVL does not instantly vanish the moment incentive campaigns end.
-
SEI defends $0.47–$0.52, lives primarily above $0.55–$0.59, and sees its flagship perpetual and spot venues regularly post trading volume and liquidity depth that genuinely rival established Arbitrum and Solana pairs.
-
Liquidity on both chains survives market rotations—meaning their order books do not fully drain when capital temporarily sloshes back toward Ethereum or monolithic AI narratives.
They Stay High-Beta Satellites If:
-
APT breaks its $8.50 baseline or repeatedly fails to clear the $9.40–$10.00 overhead resistance, confirming a deeper structural reset.
-
SEI drifts beneath $0.47 or consistently gets rejected at the $0.55–$0.59 moving average confluence.
-
The vast majority of serious, institutional-grade trading remains heavily anchored to ETH L2s and Solana, leaving APT and SEI as interesting venues for targeted bets, but not places where capital naturally parks.
Final Verdict: The level ladders and moving average positions for both assets are crystal clear. However, whether they emerge as undisputed market leaders or remain rotational side bets will be decided by verifiable, on-chain liquidity depth and trading volume, rather than technical charts alone.
Disclaimer: This article is provided for informational purposes only. It is not offered or intended to be used as legal, tax, investment, financial, or other advice.
Investment Disclaimer