

The Ethereum ecosystem is navigating a complex structural transition. The fundamental narrative is arguably stronger than ever: restaking Total Value Locked (TVL) continues to surge, Actively Validated Services (AVSs) are securing new middleware, and the OP-Stack has emerged as the premier blueprint for enterprise rollups (including Base).
Yet, for institutional allocators observing this evolution, a critical tension exists. While the underlying architecture is flourishing, the spot prices of Ethereum (ETH) and Optimism (OP) reveal a market struggling with liquidity fragmentation. The core question for traders is whether the sheer gravity of restaking and the OP-Stack can finally consolidate the fractured L2 liquidity, or if these assets will remain capped by macroeconomic headwinds and a relentless dilution of attention.
Ethereum (ETH): Restaking TVL Up, Price At Local Support
Source: tradingview
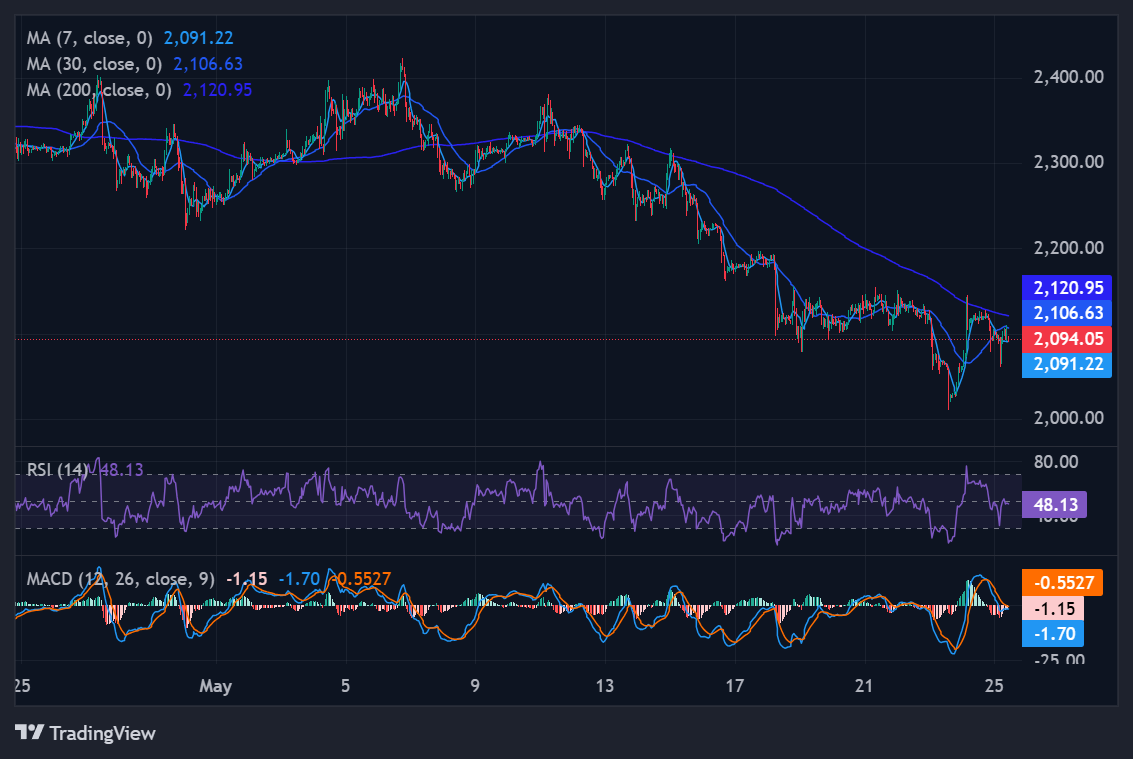
Ethereum’s 90-day structural profile remains positive (+15%), but the last 30 days have delivered a clean, undeniable pullback (-9.26%). Despite the booming restaking sector absorbing circulating supply, ETH is currently pinned near the bottom of its recent range.
The Structural Map ($2,110 to $2,370):
Immediate Support:
-
$2,110 to $2,150: ETH is resting perilously close to its recent 30-day low ($2,109.85). This is the key short-term support region. A daily close that definitively breaks below $2,100 opens the door to test the critical psychological and macro support floor at $2,000.
-
(Note: The 200-day moving average remains safely below spot, indicating the macro uptrend is not yet broken, merely digesting a 30-day down leg).
Immediate Resistance:
-
$2,240 to $2,280: The "mean reversion" band. This zone contains the 30-day Simple Moving Average (SMA) at ~$2,257. ETH must reclaim and hold above this band to prove that fundamental L2 usage and restaking demand can overpower short-term macro selling pressure.
-
$2,320 to $2,370: The local ceiling and recent swing high. Closing above $2,370 is the primary signal required to confirm a new macro leg rather than a simple relief bounce.
The Read: ETH looks like a structurally strong asset that is temporarily capped. It is oscillating in a defined $2,110–$2,370 box. The base case suggests dips near $2,100 are bought, but rallies fade near the SMA-30, fitting an environment where restaking TVL grows but ETF flows and macro conditions prevent a clean breakout.
Optimism (OP): OP‑Stack Governance Still In Sideways Mode
Source: tradingview
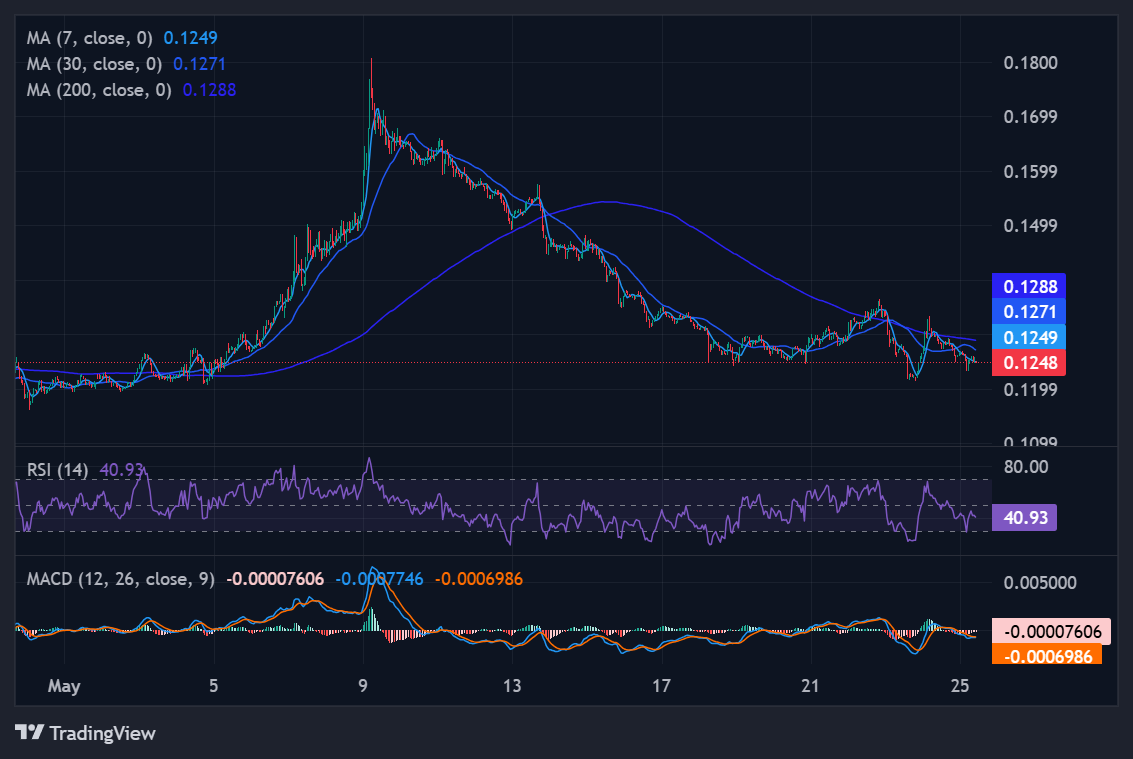
Optimism’s price action perfectly reflects its current role as a governance token in a sideways market. It is essentially flat over 30 days (-1.84%) and mildly up over 90 days (+7.24%), grinding through a classic sideways correction.
The Structural Map ($0.121 to $0.163):
Immediate Support:
-
$0.121 to $0.125: The 30-day low sits at $0.120, with the current price (~$0.130) hovering just above it. A daily close below $0.121 would confirm a new down leg, likely dragging OP back toward earlier multi-month consolidation bases.
Immediate Resistance:
-
$0.133 to $0.140: The first "mean reversion" zone, capped by the 30-day SMA (~$0.134). OP needs to reclaim and hold above this moving average to demonstrate that the massive growth of OP-Stack chains (and their integration with restaking AVSs) is successfully drawing governance buyers.
-
$0.147 to $0.163: The swing high zone. A close above $0.160 on strong volume is required to indicate that OP is being fundamentally re-rated by the market, rather than just reacting to isolated points campaigns.
The Read: OP is leaning toward the lower half of its range, slightly below its 30-day mean. The base case sees OP defending the $0.121 floor but struggling to break $0.140, reflecting a reality where L2 DeFi liquidity continues to fragment across Arbitrum, Base, Blast, and others, leaving OP to capture only a fraction of the total L2 governance bid.
Conclusion: Capture The Next Wave Or Fragment Further?
The technical alignment is clear: both ETH and OP are structurally sound but currently pinned near the bottom of their respective 30-day ranges, trading beneath their moving averages.
They Capture the Next Wave of DeFi Liquidity If:
-
ETH holds above the $2,100 floor, reclaims the $2,250–$2,280 mean-reversion band, and pushes toward $2,370+ as restaking AVSs require massive amounts of locked ETH collateral.
-
OP defends $0.121, moves firmly back into the $0.140–$0.160 region, and demonstrates that the OP-Stack's Superchain vision is actually consolidating TVL rather than cannibalizing it.
-
Market capital actively rotates back into the Ethereum ecosystem as a "flight to quality," preferring established security over highly speculative alternative L1s.
Liquidity Fragments Further Across L2s If:
-
ETH spends the summer trapped inside the $2,100–$2,300 box, unable to clear its 30-day SMA.
-
OP remains stuck between $0.120 and $0.140, failing to capture a premium for its governance model.
-
Speculative capital continues to chase the highest immediate yields, splitting liquidity heavily across Arbitrum, Base, Blast, Solana, and newer rollups, forcing ETH and OP to act merely as the structural base of DeFi rather than the performance leaders of the next leg.
Final Verdict: The TA points to range-bound behavior with oversold characteristics at local support. The fundamental infrastructure is undeniably scaling, but the spot prices suggest the market is exhausted. Until ETH clears $2,280 and OP clears $0.140, they remain in a holding pattern.
Disclaimer: This article is provided for informational purposes only. It is not offered or intended to be used as legal, tax, investment, financial, or other advice.