

JOLTS is the U.S. Bureau of Labor Statistics’ monthly survey of job openings, hires and separations. Its most closely watched number, job openings, measures the number of qualifying unfilled positions employers had on the last business day of a month—not the number of jobs added during that month.
That distinction is central to why the report matters. Vacancies offer one view of employers’ demand for workers, while hiring and separation figures show the movement of workers into and out of jobs. Investors, economists and Federal Reserve watchers read those measures together for evidence on whether the labor market is tightening, cooling or broadly in balance.
What JOLTS measures—and what counts as a job opening
The Job Openings and Labor Turnover Survey, known as JOLTS, covers private nonfarm establishments and government entities in the 50 states and the District of Columbia. The Bureau of Labor Statistics publishes six core measures: job openings, hires, quits, layoffs and discharges, other separations, and total separations.
The BLS uses a narrower definition of an opening than simply an employer saying it would like more staff. A position must exist and be unfilled on the last business day of the month; it must be available for a worker to start within 30 days; and the employer must be actively recruiting outside the establishment. A future role that has not yet become available, or a role without outside recruiting, does not meet that definition.
This makes the headline useful but specific. It is a count of vacancies meeting the survey’s criteria at one point in time. It does not directly tell a reader how many people were newly employed, how many vacancies will be filled, or whether every posted role represents equivalent demand across industries, locations or pay levels.
The survey’s breadth also explains why it attracts more attention than a single company’s hiring plans. It is designed to provide an economy-wide view across its covered employers, though it remains an estimate rather than a census of every vacancy in the United States.
Job openings are a stock; hires and separations show the monthly flows
The most useful way to read JOLTS is to separate a stock from flows. Openings are the stock: the number of qualifying vacant positions outstanding at month-end. Hires and separations are flows: activity recorded over the course of the month.
That means a high openings number does not equal monthly job creation. An employer may carry a vacancy across more than one month, fill one opening while creating another, or recruit for a role that ultimately remains unfilled. Likewise, hiring can be substantial even if openings change little, depending on how quickly employers fill available positions.
Total separations combine quits, layoffs and discharges, and other separations. Looking at the components can produce a more complete picture than the vacancies headline alone. Quits are particularly watched because they are a distinct type of separation, while layoffs and discharges capture a different part of labor turnover.
A compact example shows why the sequence matters. In the BLS release covering June 2026, job openings were little changed at 7.4 million, hires were 5.3 million and total separations were 5.4 million. Those figures describe different concepts: 7.4 million was the month-end stock of qualifying openings, while the latter two figures record monthly movements. They should not be added together or read as interchangeable measures of jobs created or lost.
For a practical read, start with the direction of openings, then ask whether hires and separations point in the same direction or tell a more complicated story. A change in vacancies may reflect a shift in employers’ desired staffing, but the flow measures help indicate what is happening as workers are actually brought on or leave jobs.

How vacancies feed into the Fed’s assessment of labor-market balance
Federal Reserve policymakers do not set policy from one JOLTS number. They assess labor-market conditions alongside other economic and financial information, and vacancies are one part of that assessment.
The economic logic is straightforward. A rise in openings can suggest that employers have more unmet demand for workers. If businesses are competing harder to fill roles, observers may infer a greater chance of wage pressure and, potentially, inflation pressure. A decline in openings can instead be read as evidence that labor demand is cooling.
Neither inference is automatic. An openings decline does not by itself establish that employment is weakening, just as a rise does not prove that inflation will accelerate. The hiring and separation measures, the scale and persistence of the move, and the wider economic setting all shape the interpretation.
The Fed itself frames vacancies within a broader question of labor-market balance. In its July 2026 Monetary Policy Report, the central bank described vacancies as roughly flat and characterized labor demand and supply as broadly in balance. That language illustrates the point: policymakers use vacancies as an indicator of the relationship between demand for workers and worker availability, rather than as a stand-alone policy trigger.
For market participants, the key question is often whether a JOLTS release changes the expected path of that balance. A reading that appears stronger than anticipated can lead investors to reconsider how quickly policy might ease. A weaker-looking report can pull expectations in the other direction. Those are judgments about implications, not conclusions supplied by the survey itself.
Why a JOLTS surprise can move Treasury yields, the dollar and stocks
Markets react to JOLTS when the data alter expectations for Federal Reserve policy. The chain runs from a labor-demand signal to expected interest rates, and then to the assets sensitive to those expected rates.
If investors see unexpectedly strong openings as evidence of resilient labor demand and possible wage or inflation pressure, they may expect a less accommodative Fed path than they had previously priced. Treasury yields can respond as expected policy rates are reassessed. The dollar may also move as relative return expectations change, while equities can respond to the prospect of different discount rates and borrowing conditions.
The reverse interpretation is also possible. A surprise decline in openings may be viewed as cooling demand, potentially supporting expectations for easier policy. But stocks do not have a guaranteed direction in either case. Lower expected rates can support valuations, while the same weak labor signal may raise concerns about growth or corporate earnings.
That is why “higher openings are good” and “lower openings are bad” are unreliable shortcuts for investors. The relevant issue is the surprise relative to expectations, the accompanying JOLTS components, and whether the release changes the market’s view of inflation, growth and the Fed. The relationship is an economic inference rather than a mechanical trading rule.
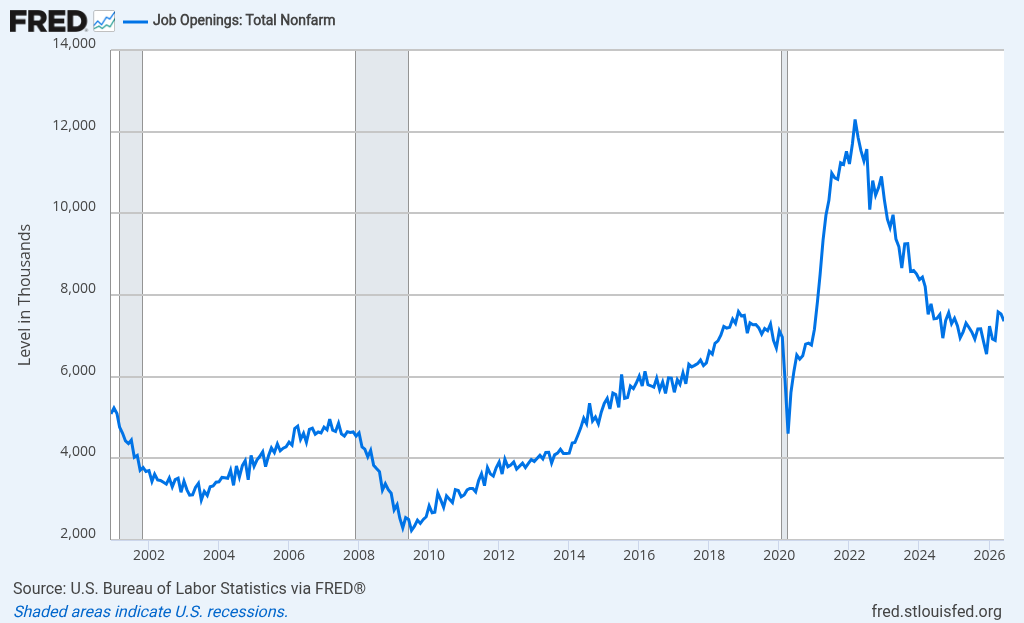
Monthly U.S. total nonfarm job openings, seasonally adjusted, in thousands. — Source: Federal Reserve Bank of St. Louis — FRED
How to read JOLTS without overinterpreting one release
JOLTS is a monthly survey, so the openings figure is already a month-end reading when it is released. It is valuable as a broad labor-demand indicator, but it is not a real-time count of every vacancy or an instant verdict on current economic conditions.
The BLS produces the estimates through a process that includes survey weighting, adjustments for nonresponse, benchmarking to Current Employment Statistics employment, birth-and-death modeling, alignment, seasonal adjustment and variance estimation. In plain terms, the published figures are constructed statistical estimates from survey data, with procedures intended to make them useful for aggregate analysis.
Readers should therefore give more weight to a pattern than to a single monthly move. The June 2026 figures, for example, are best used as an illustration of how the three headline concepts differ—7.4 million openings, 5.3 million hires and 5.4 million total separations—rather than as a self-contained verdict on the labor market.
Revisions matter as well. The BLS says JOLTS estimates are subject to sampling and nonsampling error, and its annual updates revise five years of history to incorporate updated CES benchmarks, revised seasonal factors and other adjustments. A first market reaction may be based on numbers that later change, while prior-month revisions can alter the apparent trend.
A disciplined reading checks three things: whether openings moved materially, whether hires and separations support or complicate the headline, and whether revisions changed the starting point. It also avoids treating a vacancy count as the same thing as payroll employment. JOLTS is most informative when it is treated as one component of a wider labor-market assessment.
Frequently Asked Questions
Do JOLTS job openings equal available jobs?
Not exactly. They count existing, unfilled positions that are available to start within 30 days and are being actively recruited for outside the establishment, as of the month’s last business day.
What is the difference between JOLTS and the payrolls report?
JOLTS focuses on vacancies and labor turnover, including hires and separations. The payrolls report is used to track employment levels and changes in payroll employment, so the two releases answer different questions about the labor market.
Why do investors watch quits in JOLTS?
Quits are a separately reported form of separation. They add context to openings, hiring and layoffs by showing one distinct channel through which workers leave employers.
When is JOLTS released?
The BLS publishes JOLTS monthly. Because it measures openings at the end of a reference month, readers should distinguish the period covered by the data from the day the release is published.
Is a higher JOLTS openings reading always bullish for stocks?
No. Stronger openings may be seen as supportive of economic demand, but they can also lead markets to expect a less accommodative Fed path and higher discount rates. Equity reactions depend on how investors weigh those competing implications.