

The inflation rate at which a nominal U.S. Treasury security and a comparable-maturity Treasury Inflation-Protected Security, or TIPS, would deliver the same total return is known as breakeven inflation. It is calculated as the difference between the nominal Treasury’s yield and the TIPS’s real yield, giving bond-market participants a tradable measure of the inflation compensation embedded in Treasury prices.
The measure is useful because it compares two securities issued by the same borrower over a similar horizon: one with payments stated in nominal dollars and another whose principal and coupon payments adjust with the Consumer Price Index. But a breakeven rate is not a clean, literal poll of what investors think inflation will be. It can also reflect the compensation investors demand for inflation uncertainty, differences in liquidity and short-lived trading pressures.
Breakeven inflation is the rate that equalizes nominal Treasury and TIPS returns
A nominal Treasury pays interest and returns principal in fixed dollar terms. Inflation erodes the purchasing power of those cash flows if prices rise over the life of the bond. Investors therefore generally require a nominal yield that incorporates compensation for expected inflation, alongside compensation for real returns and other market factors.
TIPS take a different approach. Their principal and coupon payments are adjusted for changes in the CPI, which is why their yields are commonly read as real yields. A TIPS investor is still exposed to market-price movements if selling before maturity, but the security’s CPI indexation distinguishes its cash-flow structure from that of a conventional Treasury. The Federal Reserve Board’s description of TIPS yield curves and inflation compensation sets out this relationship between nominal Treasury yields, real TIPS yields and the implied breakeven rate.
Set beside each other, the two yields create a threshold. If average inflation over the relevant period matches the breakeven rate, the nominal Treasury and the comparable TIPS would provide the same total return. Inflation above that threshold favors the inflation-indexed structure in this simplified comparison; inflation below it favors the nominal structure.
That is the meaning of “breakeven.” It does not mean inflation is guaranteed to reach that rate, nor does it identify the path CPI will take in each month or year. It represents the rate embedded in the relative pricing of the two instruments.
Subtract the comparable-maturity TIPS yield from the nominal Treasury yield
The basic calculation is straightforward:
Breakeven inflation rate ≈ nominal Treasury yield − comparable-maturity TIPS yield
Comparable maturity is essential. A 10-year nominal Treasury should be compared with a 10-year TIPS, rather than with a five-year or 30-year inflation-protected bond. Interest-rate and inflation expectations can differ materially across time horizons, so a mismatch can turn a useful comparison into a misleading one.
Consider a simple 10-year example. If the nominal Treasury yield is 4.3% and the 10-year TIPS real yield is 2.0%, the implied 10-year breakeven inflation rate is approximately 2.3%:
| Input | Yield |
|---|---|
| 10-year nominal Treasury | 4.3% |
| 10-year TIPS | 2.0% |
| Implied breakeven inflation | 2.3% |
The arithmetic is 4.3% minus 2.0%. The Federal Reserve’s discussion of TIPS uses the same approximate framework. The word “approximately” matters: market yields and inflation-linked cash flows involve conventions and pricing details that make the shorthand spread an inflation-compensation measure rather than a complete model of realized returns.
Still, the calculation makes breakevens accessible. When the nominal yield rises while the matched TIPS yield does not, the breakeven widens. When the real TIPS yield rises more than the nominal yield, the breakeven narrows. Those movements describe changes in relative market pricing; explaining why they occurred requires more care.

Nominal Treasuries and TIPS supply the two sides of the market signal
Nominal Treasuries are conventional U.S. government securities. Their coupon and principal payments are not adjusted for inflation. Their stated yield is therefore nominal: it is expressed before accounting for changes in consumer prices.
TIPS are also U.S. Treasury securities, but their principal and coupon payments are adjusted according to CPI changes. That indexation is the crucial component of the breakeven comparison. It allows their quoted yield to be commonly interpreted as a real yield, meaning a yield measured relative to inflation rather than in unadjusted dollars.
The comparison works best when the securities are similar in maturity and when the observer understands what is being compared. A breakeven is a yield spread, not a direct comparison of coupon rates, and it is not simply the difference between two investors’ individual returns. It arises from the prices at which the market values nominal and inflation-indexed Treasury cash flows.
Market participants can use that spread as a common reference point because both legs are Treasury instruments. Central banks, economists, portfolio managers and other observers may track it alongside surveys, inflation data and other measures. None of those tools answers precisely the same question. Survey respondents report views; CPI describes price changes that have occurred; a breakeven reflects prices in a market at a given time.
What a 10-year breakeven rate says about inflation over the next decade
A 10-year breakeven is generally read as market-based inflation compensation over the next decade. In the simplified equal-return interpretation, it is the average inflation rate over that horizon that would make holding a 10-year nominal Treasury and a comparable 10-year TIPS equivalent in total-return terms.
“Average” is a key word. A 10-year figure does not say inflation will be constant at that level every year. A period of high inflation followed by lower inflation could produce the same broad average as a steady path, while producing very different economic conditions and market outcomes along the way.
Readers commonly encounter the measure through the Federal Reserve Bank of St. Louis’ FRED database. Its 10-Year Breakeven Inflation Rate series, T10YIE, is derived from 10-year nominal Treasury constant-maturity yields and 10-year Treasury inflation-indexed constant-maturity yields. FRED’s series listing records a 2.31% observation for August 28, 2026.
That series is a convenient benchmark, but the label should not be overread. It indicates a market-implied compensation measure at a 10-year horizon, not a prediction that CPI will rise by the displayed rate in every future year or a definitive estimate of the public’s inflation outlook.
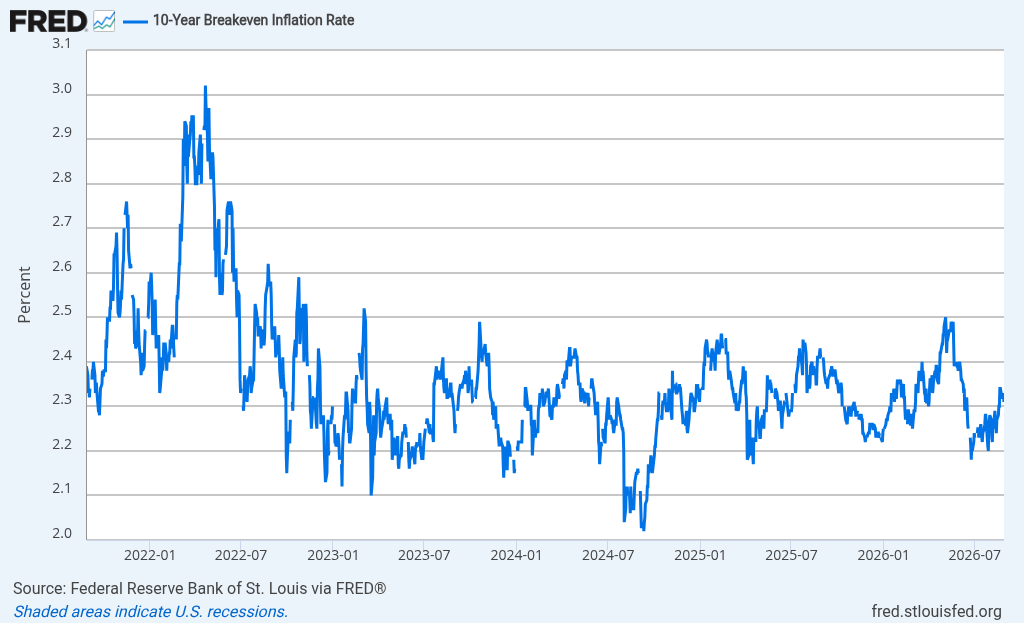
Historical daily 10-Year Breakeven Inflation Rate, a market-based measure of average expected inflation over the next decade. — Source: Federal Reserve Bank of St. Louis FRED
Why breakeven inflation is not the same as an inflation forecast
The central limitation is that breakeven inflation combines more than expected inflation. The Federal Reserve has summarized the relationship as inflation compensation equaling expected inflation, plus an inflation risk premium, plus other factors. A breakeven rate can be an informative market gauge without being a pure forecast.
An inflation risk premium is compensation associated with uncertainty about future inflation. Investors in nominal bonds face the risk that realized inflation could diminish the purchasing power of fixed cash flows by more than anticipated. Changes in that premium can move the nominal-versus-real yield spread even if investors’ central expectation for inflation has not changed.
Liquidity is another consideration. TIPS liquidity premiums may affect their yields and, by extension, the spread against nominal Treasuries. Temporary market-specific trading effects can also influence the quoted breakeven. The Federal Reserve’s analysis of inflation risk premiums cautions that these components can affect market-based inflation compensation.
As a result, a falling breakeven rate cannot be translated one-for-one into a fall in underlying inflation expectations. It may partly reflect lower expected inflation, but it may also reflect a change in the inflation risk premium, a liquidity effect or other market factors. The reverse is true when the spread rises.
Breakevens are consequently most useful as one input rather than a standalone verdict. Comparing maturities can help distinguish near- and longer-horizon pricing, while comparing the spread with surveys and realized inflation data can provide context. The measure’s value lies in its being market priced and continuously observable; its limitation is that the market price embeds several influences at once.
Frequently Asked Questions
What does a 2% breakeven inflation rate mean?
In the basic matched-maturity comparison, it means average inflation of about 2% over the bond horizon would equalize the total return on the nominal Treasury and the TIPS. It is an implied threshold, not a guarantee of realized inflation.
How is the 10-year breakeven inflation rate calculated?
Subtract the 10-year TIPS real yield from the 10-year nominal Treasury yield. A 4.3% nominal yield and 2.0% real yield imply an approximate 2.3% breakeven.
Why must Treasury and TIPS maturities match?
Yield levels reflect conditions over particular time horizons. Matching maturities helps ensure the spread captures inflation compensation over the same period rather than differences between, for example, five-year and 10-year rates.
Does a higher breakeven always mean investors expect higher inflation?
No. Higher expected inflation can widen the spread, but so can changes in inflation risk premiums, TIPS liquidity premiums and market-specific trading conditions.
Is breakeven inflation the same as CPI inflation?
No. CPI is an index used to measure price changes, while a breakeven is a market-derived yield spread that reflects compensation related to expected future inflation and other factors.