

The Advance-Decline Line, often shortened to the A/D Line, is a cumulative market-breadth indicator. It adds the number of declining securities from the number of advancing securities for each period, then adds that net result to the line’s previous value. The result is a running measure of whether gains or losses are being shared across the selected market universe.
It is most useful beside a stock index. An index can rise even when relatively few constituents are advancing, particularly if its largest companies are doing much of the lifting. The A/D Line provides a different question: how many issues are participating? That makes it a tool for testing the character of a rally, rather than a replacement for price analysis.
How the A/D Line works
For any trading day, start with two counts: advancing issues and declining issues. Subtract declines from advances to find net advances. A positive result means more issues rose than fell; a negative result means more fell than rose.
The calculation is then carried forward rather than reset every day:
Current A/D Line = Prior A/D Line + (Advancing Issues − Declining Issues)
Suppose a line begins at 1,000. On the first day, 600 securities advance and 400 decline, producing net advances of 200 and a new line value of 1,200. The following day, 450 advance and 550 decline. Net advances are negative 100, so the line falls to 1,100. The level itself is less important than its direction, trend and relationship with the chosen index.
This cumulative design distinguishes the A/D Line from a one-day advance-decline reading. A single session can be noisy or driven by a short-lived event. By continually incorporating daily net advances, the line can show whether participation has generally been improving or deteriorating over a longer stretch. StockCharts ChartSchool describes the indicator as a cumulative total of each period’s net advances.
A rising line generally indicates that more securities are taking part in advances. A falling line points to broader weakness among the issues included in the calculation. Neither reading says, by itself, where an index must go next.
Why breadth and index price can diverge
The A/D Line and a major equity index do not give every stock equal influence. In a traditional A/D calculation, each advancing or declining issue generally contributes one count, regardless of its market capitalization or trading volume. As a result, a small company affects the daily breadth count as much as a much larger company.
Many widely followed indexes, by contrast, are capitalization-weighted. Their largest constituents carry the greatest influence over daily index movement. If a handful of very large companies rise sharply, they can lift such an index even while a greater number of smaller constituents decline.
A rising index and a weakening A/D Line can therefore coexist: the two measures capture different dimensions of the market. Index price reflects weighted price movement; breadth reflects the balance of winning and losing issues. Since the A/D Line is not capitalization-weighted, it can be useful for detecting whether participation extends beyond the market’s largest names.
A broad advance is not automatically stronger in every respect, and a concentrated advance is not automatically unsustainable. But the comparison can reveal concentration that an index level alone does not show.

Confirmation, divergence and lower highs
Analysts usually read the A/D Line by comparing its path with the path of an index drawn over the same period. When the index and the line both make higher highs or continue rising together, the move is often described as breadth confirmation. More stocks are participating in the advance, rather than price being supported by a narrower group.
The more closely watched contrast occurs when the index rises while the A/D Line falls or fails to keep pace. That is a negative breadth divergence. It suggests that participation is narrowing beneath the headline index gain and may leave the rally more vulnerable to reversal, though it does not establish that a reversal will occur.
Lower highs can add another layer. Imagine an index reaches a new peak, pulls back, and then rises to another new peak. If the A/D Line’s second rally fails to exceed its prior high, the breadth measure has formed a lower high while the index has strengthened. The gap does not identify a date for a market turn. It identifies a change in the internal participation behind the move.
Nasdaq offered a recent illustration in a June 2026 market review, reporting that the S&P 500’s A/D Line had made a lower high while the large-cap index continued to rise. The example shows how a breadth divergence can flag increasing concentration during an apparently strong rally; it should not be read as a market call. Nasdaq’s review framed the observation as a measure of the market’s internal condition.
The reverse pattern can also matter. An index may be weak or range-bound while the A/D Line improves, indicating that advancing issues are becoming more numerous. Such positive divergence can be worth monitoring, but it is still context rather than a mechanical buy or sell instruction.
The universe behind the line
An A/D Line is only as interpretable as the group of securities it counts. Before drawing conclusions, a reader should establish whether the data cover an exchange, an index’s constituents, common stocks only, or a broader set of listed issues. Lines with similar names may not measure the same market.
The distinction can be material. An SEC-filed fund document distinguishes an NYSE all-issues line from an NYSE common-stocks-only line. The all-issues version includes securities such as preferred stocks and closed-end funds, while the common-stocks-only version is focused on operating-company stocks.
Including non-operating-company securities can produce a reading different from one based solely on common stocks. Neither version is inherently incorrect. They answer slightly different questions because their participants differ. A comparison with an equity index is generally clearest when the breadth universe is relevant to the index or market segment under review.
This is also why historical comparisons require care. A change in the composition of the selected universe, or a comparison of differently constructed series, can alter what appears to be a change in breadth. The label attached to the line is not enough; the underlying inclusion rules matter.
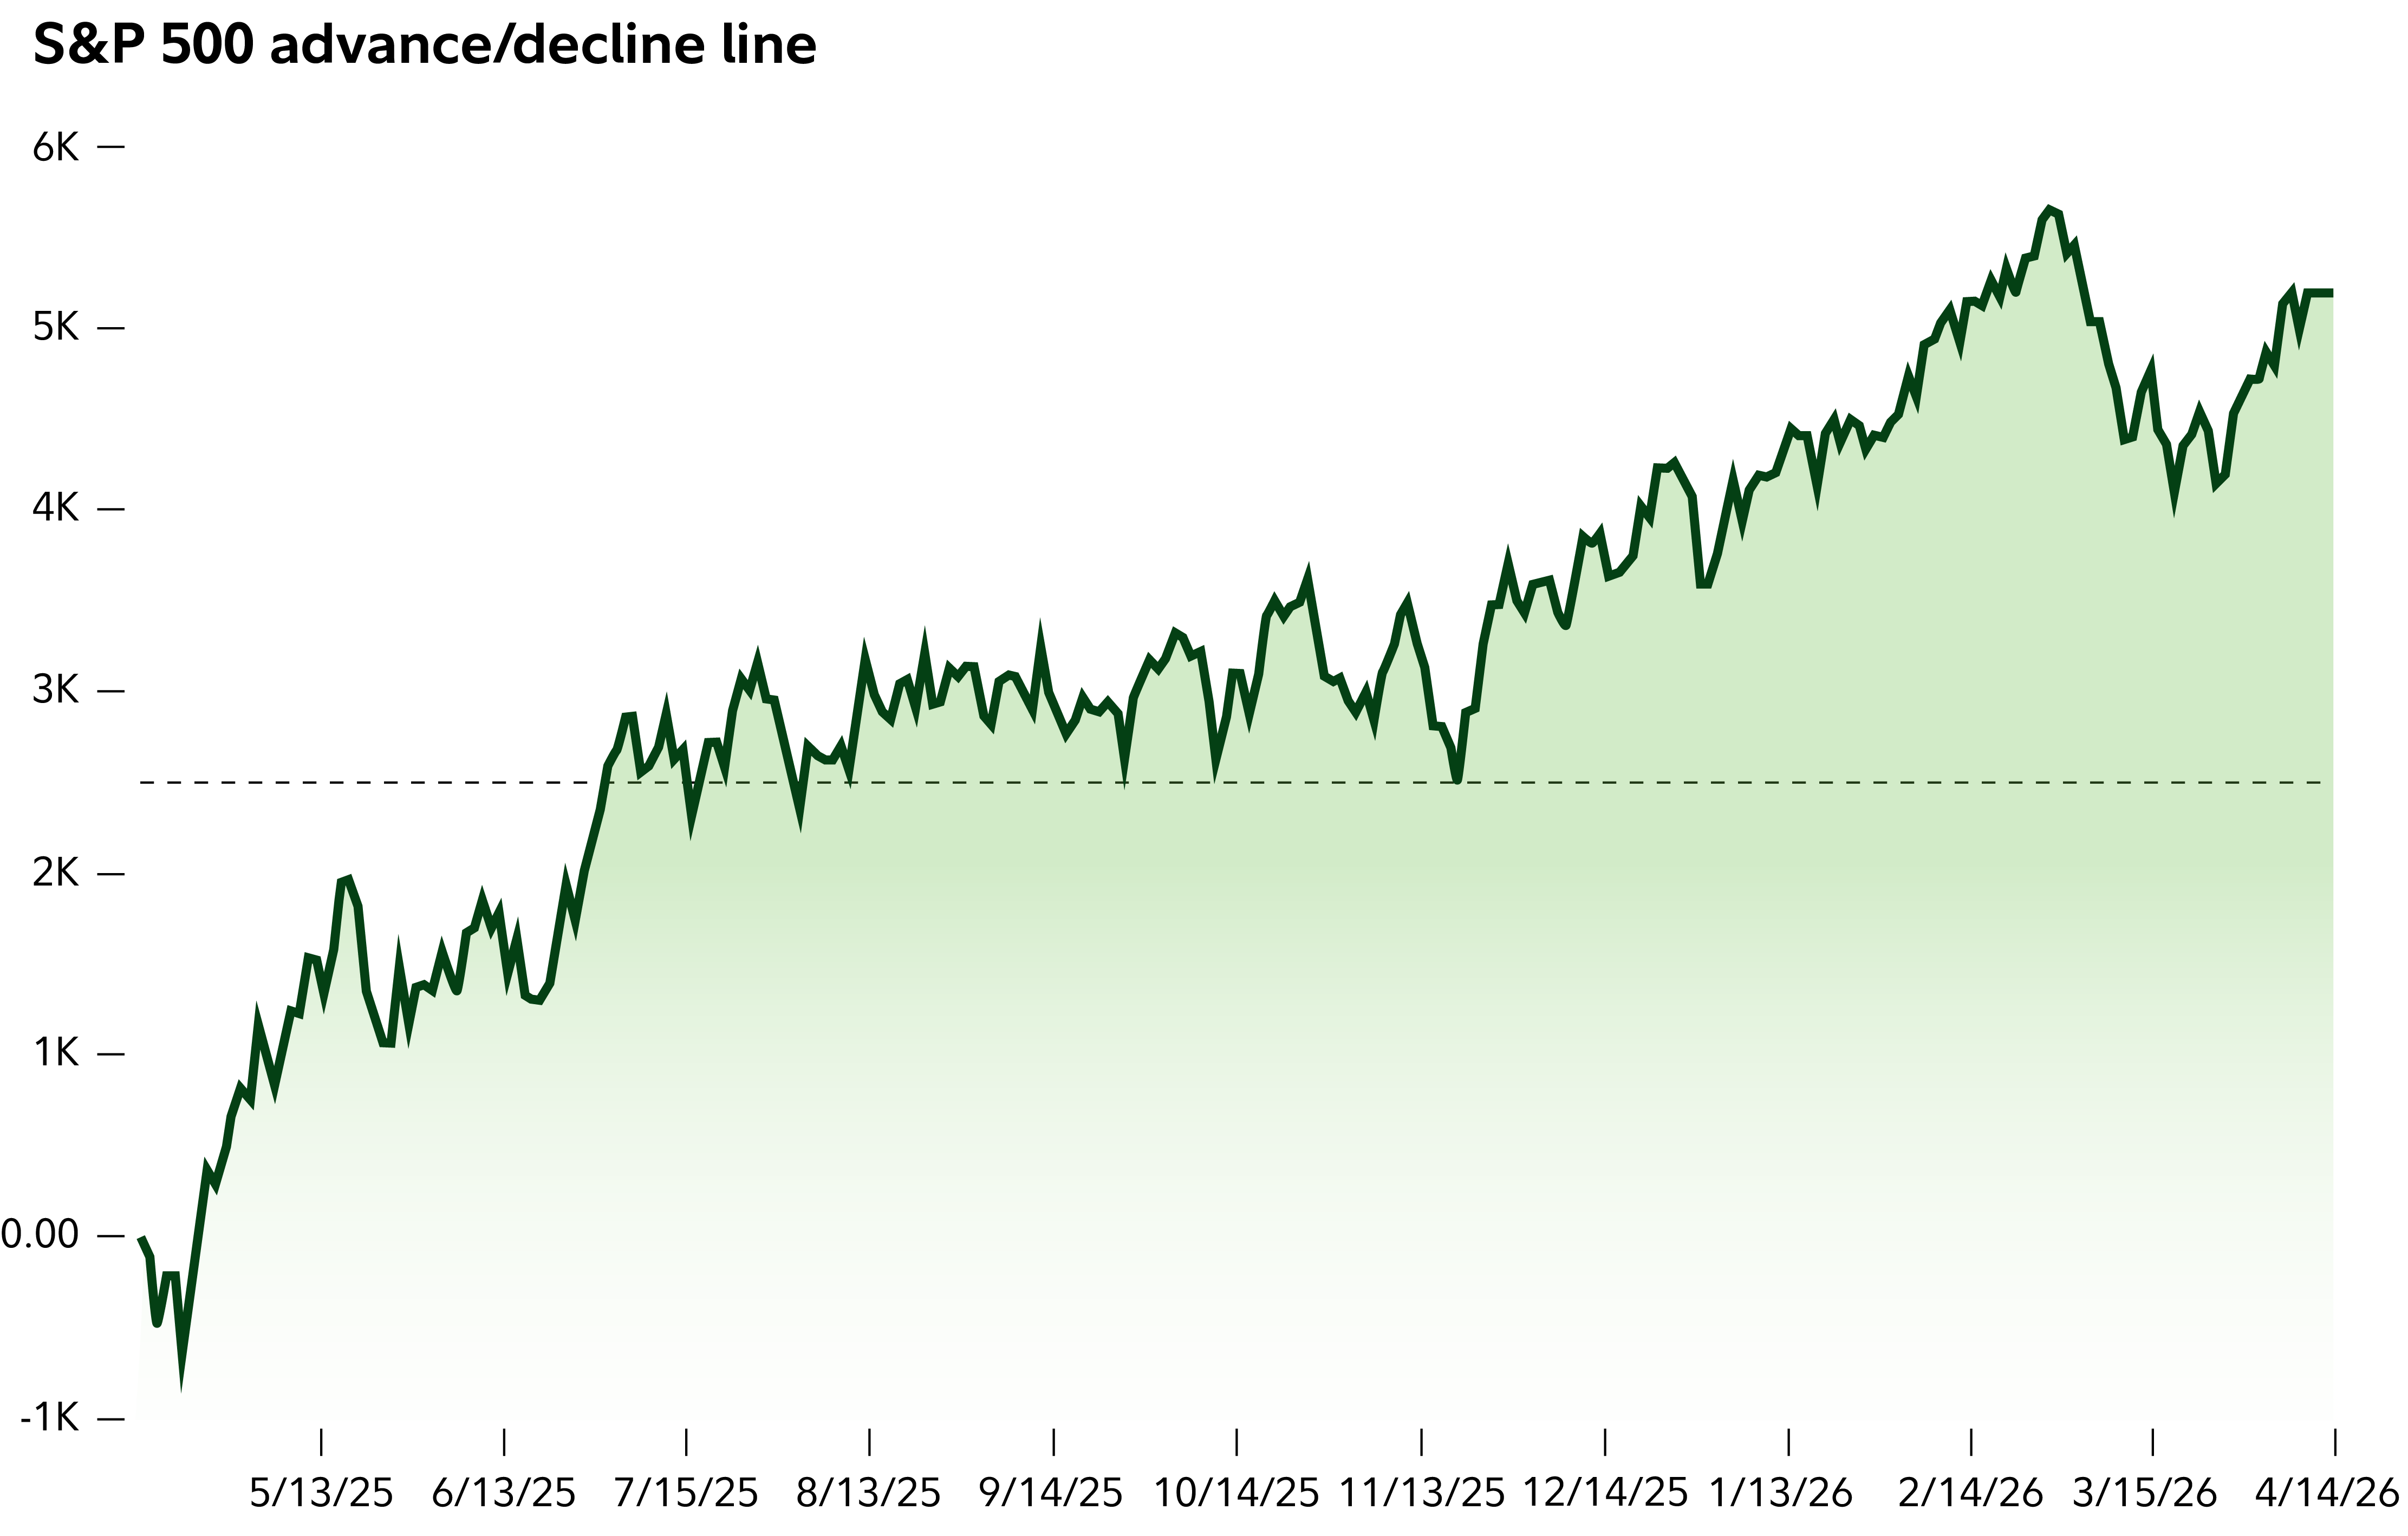
S&P 500 advance/decline line chart, showing the cumulative breadth measure over time. — Source: Fidelity Viewpoints
Using breadth without overreading it
The practical role of the A/D Line is to add context to price action. An investor or analyst following a major index can observe whether the line is rising with the index, lagging it, or moving in the opposite direction. That comparison may help frame questions about how widely a trend is shared and whether leadership has become more concentrated.
It is not a timing device. Divergences can persist, and markets can continue rising despite weak breadth or falling despite improving breadth. Treating every divergence as a prediction of an immediate reversal confuses a condition of participation with a forecast of timing.
Academic discussion of the measure cautions against assuming that its usefulness as a leading indicator is established. The A/D Line is better used with price, volume and risk analysis than in isolation, according to a University of Edinburgh research paper examining market-breadth measures.
A disciplined approach therefore has three parts. First, identify the security universe. Second, compare the cumulative line with the relevant index over a meaningful period rather than reacting to one daily reading. Third, treat confirmation or divergence as evidence to investigate alongside other information, not as a substitute for risk management or an automatic trading signal.
Frequently Asked Questions
What is the Advance-Decline Line formula?
Add each period’s net advances to the previous line value. Net advances equal the number of advancing issues minus the number of declining issues.
Does a falling A/D Line guarantee a stock-market crash?
No. It indicates broader weakness in the selected universe, and a divergence with a rising index can warrant analysis, but it does not guarantee either a reversal or its timing.
Is the A/D Line capitalization-weighted?
Traditional versions are not. Each advancing or declining issue generally contributes one count, so the calculation does not give a larger company more weight because of its market value.
Which Advance-Decline Line should I use?
Use a series whose universe matches the market question being asked. Check whether it covers all issues, common stocks only, a particular exchange, or the constituents of a particular index.
How does the A/D Line differ from daily advance-decline data?
Daily data show that session’s balance of advancing and declining issues. The A/D Line accumulates those net readings over time, making its trend easier to compare with an index trend.