
Astar (ASTR): Polkadot EVM And dApp Hub, Kava (KAVA): CDP‑Style L1 With Native DeFi – Do They Become A “Multi‑VM Hub + On‑Chain Credit” Stack Or Stay Mid‑Cap Alt‑L1s In The Background?
Developers are seeking out highly specialized architectural stacks. To build scalable, cross-chain financial products, the ecosystem requires two distinct foundational layers: a programmable, multi-virtual machine (Multi-VM) execution environment and a robust, native on-chain credit facility.
Astar (ASTR) operates as the "Multi-VM Hub," providing a unified environment for both EVM and WebAssembly (WASM) smart contracts within the Polkadot ecosystem and beyond, recently bolstered by its June 2026 cross-chain architecture upgrade. Meanwhile, Kava (KAVA) functions as the "On-Chain Credit Leg," acting as a Cosmos-based Layer-1 built specifically around Collateralized Debt Position (CDP) lending, stablecoin liquidity, and emerging Real-World Asset (RWA) ecosystems.
Together, they conceptually outline an incredibly potent “Multi-VM Hub + On-Chain Credit” stack. However, analyzing their 30-day structural corridors reveals two mid-cap alt-L1s currently navigating deep downtrends and heavy consolidation. Are they coiling to become a core DeFi spine, or will they remain background players in a market dominated by Ethereum Layer-2s and Solana?
Astar (ASTR): Multi‑VM / Polkadot dApp Hub
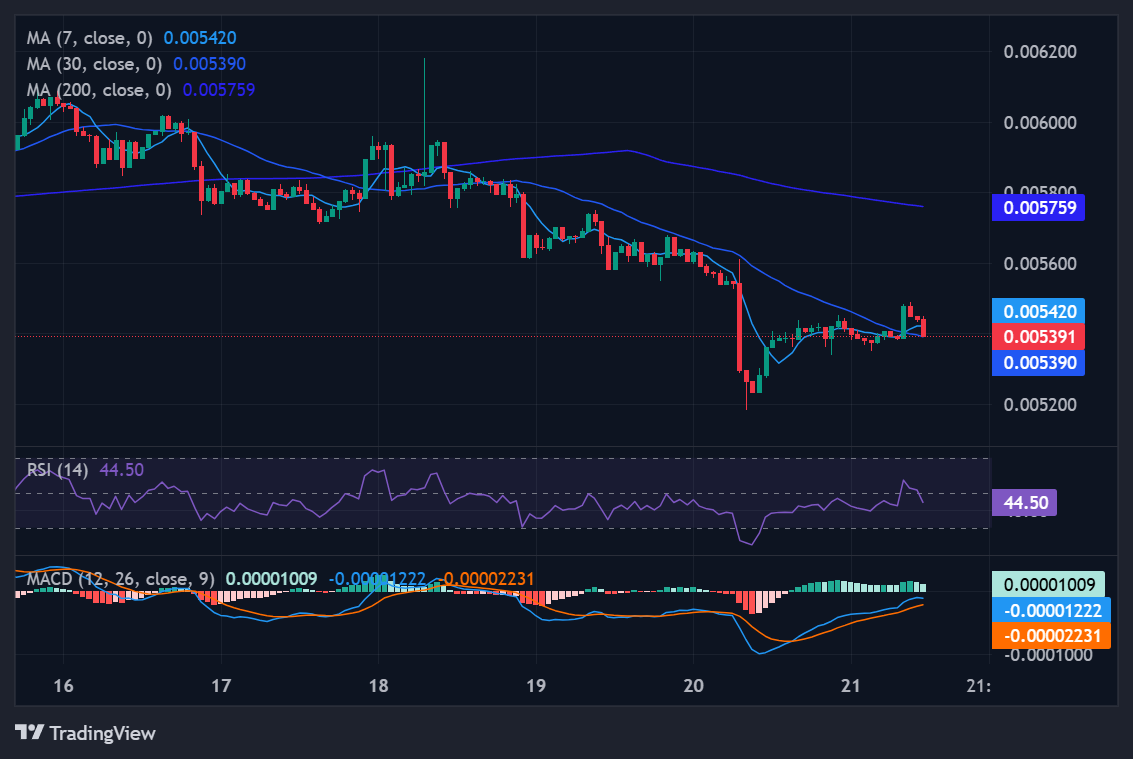
Source: tradingview
Astar recently executed a critical upgrade on June 8, 2026, transitioning ASTR into a native cross-chain token utilizing Chainlink CCIP. This enables a seamless burn-and-mint bridge between the Astar Network and Soneium. Despite this fundamental milestone, Astar’s technical tape illustrates an asset trapped deep in a multi-timeframe downtrend.
Trend and Structural Reality:
-
Moving Average Suppression: Trading at $0.0053887, ASTR sits cleanly below its 7-day Simple Moving Average ($0.00574), its 30-day SMA ($0.00648), and its macro 200-day SMA ($0.00858).
-
Oversold Momentum: The MACD line (-0.00047) is negative, though a microscopic positive histogram (+0.00003) points to the very first signs of easing sell pressure. However, daily RSIs have plunged into the low-30s (RSI-7: 29.82, RSI-14: 32.21), denoting deeply oversold conditions that can stubbornly persist during macro liquidations.
Key Structural Zones ($0.00518 to $0.00826 Swing):
-
Support Zone 1 (SP1 - $0.00518 to $0.00584): The primary accumulation pocket spanning from the absolute swing low up to the 78.6% Fibonacci retracement. ASTR is currently grinding near the lower boundary of this zone.
-
Support Zone 2 (SP2 - $0.0045 to $0.0052): The deeper speculative baseline. Slipping here implies another 10% to 15% markdown.
-
Resistance Zone 1 (RP1 - $0.00636 to $0.00672): The 61.8% to 50.0% technical retrace block, closely guarding the 30-day SMA. Reclaiming this ceiling is mandatory for any trend repair.
-
Resistance Zone 2 (RP2 - $0.00709 to $0.00754): The upper-range structural ceiling leading toward the recent $0.00826 peak.
1-3 Month Base Case ($0.0045–$0.0065): The RSI remains trapped between 30 and 45. ASTR uses SP1 as a sluggish floor, occasionally testing SP2, but ultimately struggles to break and hold the RP1 resistance band as Polkadot ecosystem liquidity remains modest.
Kava (KAVA): CDP‑Style L1 / On‑Chain Credit Leg
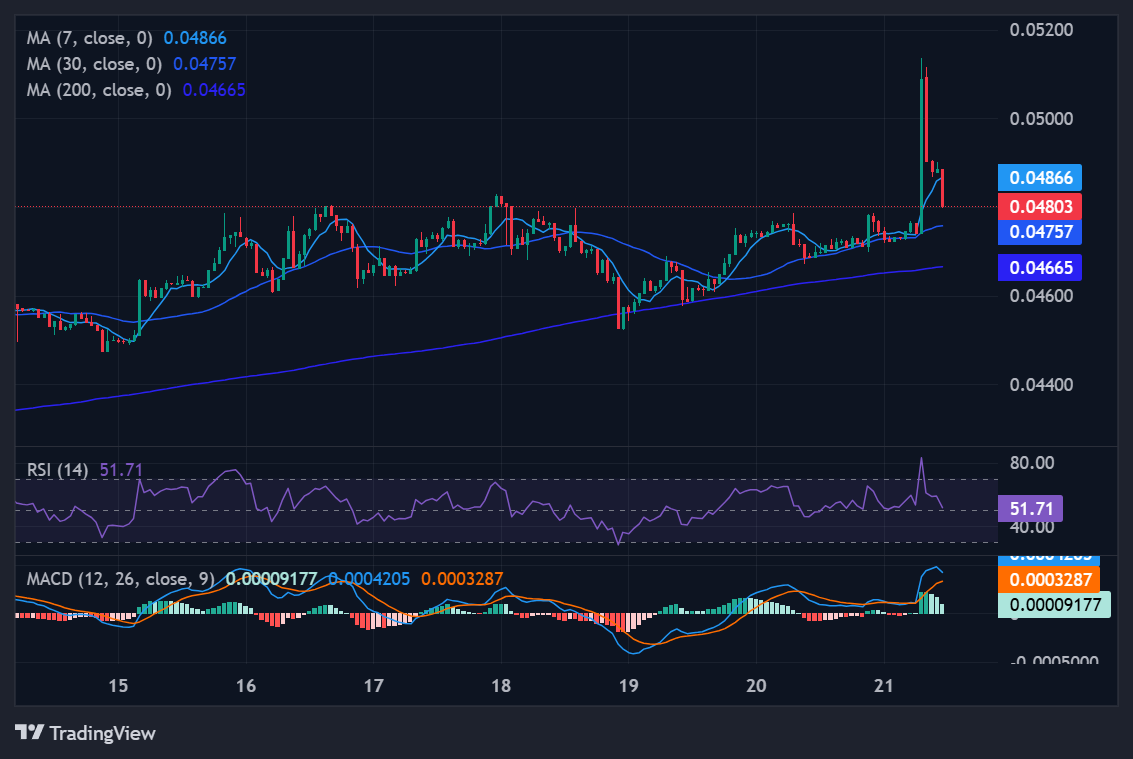
Source: tradingview
Kava is executing an aggressive 2026 roadmap, prioritizing native USDT liquidity, AI-assisted execution, and a newly launched tokenized Real-World Asset (RWA) ecosystem. Its technical structure reflects a milder downtrend compared to Astar, buoyed by significantly higher daily trading volume (~$24.8M vs ~$2.3M).
Trend and Structural Reality:
-
Proximity to Trend Averages: At $0.047817, KAVA has managed a short-term bounce, pushing slightly above its 7-day SMA ($0.04688). It remains locked beneath its 30-day SMA ($0.05005) and its 200-day SMA ($0.06475).
-
Improving Momentum: The MACD line (-0.00211) is negative, but a clearly positive histogram (+0.00079) confirms an active attempt at trend repair. The 14-day RSI hovers at 44.26, indicating an asset that is weak but fundamentally stronger and less washed out than ASTR.
Key Structural Zones ($0.039738 to $0.061915 Swing):
-
Support Zone 1 (SP1 - $0.0445 to $0.0482): KAVA is currently trading near the top of this primary 78.6% to 61.8% Fibonacci retracement block.
-
Support Zone 2 (SP2 - $0.0397 to $0.0445): The critical swing-low basement. Breaking down into this pocket sets up a deeper macro reset.
-
Resistance Zone 1 (RP1 - $0.0508 to $0.0534): The 50.0% to 38.2% Fib band containing the 30-day SMA. KAVA must clear and hold this moving average to flip bullish.
-
Resistance Zone 2 (RP2 - $0.0567 to $0.0619): The upper expansion band pushing back to the monthly swing high.
1-3 Month Base Case ($0.044–$0.055): Macro environments remain mixed. KAVA leans on its SP1 floor and chops toward the RP1 ceiling, keeping its 14-day RSI oscillating around 40 to 55 as its CDP and stablecoin flows tick along steadily.
Conclusion: A “Multi‑VM Hub + On‑Chain Credit” Stack Or Background Alt‑L1s?
The technical metrics describe two mid-cap infrastructure assets executing different phases of cycle digestion. ASTR is grappling with deeply oversold conditions, while KAVA is mounting a steady, volume-backed attempt at short-term trend repair.
They Become a Coherent “Multi‑VM Hub + On‑Chain Credit” Stack If (Over the Next 1–6 Months):
-
ASTR successfully defends its SP1/SP2 baseline, completely halts its downward bleed, and aggressively reclaims the $0.00636–$0.00672 resistance block. Its recent native cross-chain token upgrade must translate into verifiable TVL growth and multi-VM usage.
-
KAVA treats its SP1 zone as an unbreakable floor, closes cleanly above its 30-day moving average, and probes its RP2 highs ($0.0567+) as its Q2 2026 RWA ecosystem drives massive new on-chain credit demand.
-
Ecosystem Pairing: Cross-chain strategies and asset managers visibly treat the two protocols as a unified stack—routing programmable logic and cross-chain execution through Astar, while natively sourcing heavy CDP credit and stablecoin liquidity from Kava.
They Remain Background Alt-L1s If:
-
ASTR remains pinned beneath its 30-day SMA inside the $0.0045–$0.0065 corridor, continually trading as a low-volume, speculative Polkadot-side bet.
-
KAVA fails to breach its moving averages, chopping sideways while massive Ethereum Layer-2s and entrenched DeFi blue-chips continue to dominate the global lending and perpetuals market.
Final Verdict: At present, both assets remain strictly beneath their key 30-day trend bands. While their combined architecture offers a fascinating blueprint for Web3 financial products, they are currently trading as background Alt-L1s. Their evolution into a dominant stack depends entirely on breaking their immediate overhead resistance and capturing tangible market share away from the legacy ecosystem titans.
Investment Disclaimer