

Bitcoin’s 30-day correlation with gold reached 0.8 by late August, an unusually close alignment between an asset still shaped by crypto-market plumbing and a metal with centuries of monetary history. Its 90-day rolling correlation with gold also hit an all-time high, according to The Block.
The timing makes the signal less straightforward than the phrase “digital gold” suggests. The Federal Reserve’s 10-year inflation-indexed Treasury yield stood at 2.42% on August 28, up from 1.88% at the start of the year in the available series. That is a less forgiving backdrop for gold and bitcoin alike: neither provides an income stream, so higher inflation-adjusted returns on government debt increase the cost of holding them.
There is a coherent macro case for treating the two assets as expressions of concern about currency purchasing power. But a correlation says that prices have moved together over a defined window, not that they are responding to one force in the same way, or that they will continue to do so. The late-August alignment is better understood as a market regime than as proof that bitcoin has acquired gold’s enduring role.
A record 0.8 correlation meets rising 10-year real yields
Correlation can be useful because it captures a change in market behavior that price levels alone may conceal. A 0.8 reading on a 30-day rolling basis means bitcoin and gold were moving in unusually close synchronization during that period. For a market looking for evidence of a broad debasement trade, the comparison is naturally appealing.
Yet the same setup contains the trade’s main vulnerability. Real yields are the return investors can seek from inflation-protected Treasury securities, and they provide a practical benchmark for assets that do not generate cash income. When real yields rise, the relative appeal of holding gold or bitcoin can diminish even if concerns about inflation, fiscal policy or currencies remain part of the market narrative.
The move from 1.88% at the beginning of 2026 to 2.42% on August 28 is material precisely because it runs against the simple version of that narrative. A shared fear of monetary debasement is not the only condition that matters. The price of forgoing a real return elsewhere matters too, and it can become the common pressure point for both assets.
This does not mean a higher real-yield environment mechanically requires lower bitcoin or gold prices. Markets can price several forces at once, and the evidence available here shows the two assets rose together in late August despite the increase in real yields. It does mean that the current co-movement should not be read as a one-way macro relationship. A further rise in real yields could test the alignment rather than confirm it.
Past correlation spikes preceded bitcoin rallies, but not a permanent relationship
The bullish historical case has real, if limited, support. After bitcoin-gold correlation reached roughly 0.6 in late 2020, bitcoin gained 172%. When correlation rose from about zero to 0.5 in late 2022, bitcoin rallied nearly 350% over the following 14 months, according to the figures reported by The Block.
Those episodes are enough to make the present reading noteworthy. They suggest that a period in which bitcoin begins to trade more closely with gold can precede bitcoin taking the lead in a rally. In that sense, the correlation may be a useful signal of changing investor appetite or a shift in the macro factors receiving the most attention.
They do not establish that correlation caused the subsequent gains. Nor do two prior episodes turn a short-term statistical relationship into a durable equivalence between the assets. The distinction matters because the digital-gold label often compresses a much larger claim: that bitcoin will reliably share gold’s behavior when monetary conditions become uncertain.
Bitwise’s 90-day chart instead shows bitcoin’s correlation with gold moving widely between positive and negative readings since 2016. Its relationship with the dollar has often been inverse, but the gold linkage itself has not been stable. The historical record therefore supports a narrower conclusion: the current synchronization may identify a particular market regime, not a permanent change in bitcoin’s market character.
A regime can be valuable to traders and observers without being structural. It can last long enough to shape portfolio flows and public narratives, then weaken once a different driver becomes dominant. That is particularly relevant for bitcoin, where access vehicles and fund flows can have an identifiable influence on demand over short periods.

August’s bitcoin rally had an ETF-demand mechanism
The late-August bitcoin move was not solely a macro expression. Bitwise reported that U.S. spot bitcoin ETFs recorded approximately $865 million of net inflows in the second week of August 2026. Bitcoin later rose from roughly $62,900 to $78,300 during the final week of the month.
The sequence does not prove that those inflows alone produced the rally. Markets rarely offer a single clean cause, particularly across a month in which broader macro positioning may also be changing. But it identifies a concrete demand channel beneath the bitcoin leg of the apparent shared trade.
That channel is important because it is specific to bitcoin’s current market structure. Spot ETFs allow capital to enter bitcoin through a familiar fund format, and net inflows are evidence of buying demand through those products. Gold can also be bought through ETFs, but the supplied data show a notably different pattern in its investment flows during the second quarter.
The point is not that ETF demand invalidates a debasement narrative. The two can coexist: investors may use spot bitcoin ETFs to express a macro view. The problem comes when a visible price correlation is treated as though it separates those explanations. It does not. Bitcoin’s August performance included a product-flow mechanism that must be considered before assigning the move entirely to a shared monetary hedge thesis.
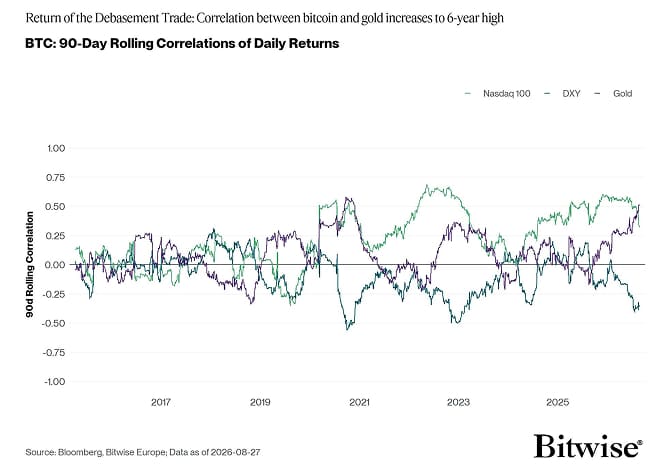
BTC 90-day rolling correlations with the Nasdaq 100, DXY and gold; data as of August 27, 2026. — Source: Bitwise Europe
Gold’s central-bank bid is support bitcoin cannot replicate
Total gold demand reached 2,522 tonnes in the first half of 2026, up 2% year over year and worth a record $380 billion, according to the World Gold Council. The same data show Q2 investment demand falling 51% quarter on quarter to 262.2 tonnes, with gold ETFs recording 44.8 tonnes of outflows.
The more durable distinction lies elsewhere in the demand mix. Central banks and other institutions bought an estimated 288.9 tonnes of gold in Q2, up 62% from a year earlier, following 243.7 tonnes in Q1. The World Gold Council expects central-bank demand in 2026 to remain strong, although probably below 2025 levels.
Bitcoin has no equivalent structural buyer base in the evidence presented here. Its late-August support included substantial U.S. spot-bitcoin-ETF inflows; gold combined official-sector and institutional purchases with a quarter of gold-ETF outflows. Gold’s total demand could remain strong even when one investment channel weakens, whereas bitcoin’s observed support had a more direct ETF-flow component.
That is why the 0.8 correlation should be read as a description of a synchronized moment rather than proof of interchangeability. Rising real yields could pressure both non-yielding assets and break the apparent correlation, while gold would still retain its distinct official-sector source of demand.