

The Crypto Fear & Greed Index is a daily sentiment gauge that turns Bitcoin-market behavior into a score from 0 to 100. On Alternative.me’s scale, 0 represents extreme fear and 100 represents extreme greed. It is designed to offer a compact view of whether market conditions appear driven more by caution or enthusiasm at a given point in time.
That simplicity can be useful, but it also creates a common misunderstanding: a single number is not a universal measure of every crypto asset, nor is it an instruction to buy or sell. Alternative.me’s version is primarily focused on Bitcoin-market sentiment, using a mix of observable market and attention-related inputs rather than a direct poll of all crypto investors.
The daily 0–100 score measures Bitcoin-market sentiment
The index places sentiment on a continuum. Readings toward the low end indicate a market environment associated with extreme fear; readings toward the high end indicate extreme greed. The middle of the range is simply less extreme. It should not be treated as a declaration that the market is fundamentally cheap, expensive, safe or unsafe.
Alternative.me publishes the index as a daily reading, along with a plain-language classification. The score’s main value is compression: it brings several measures that may otherwise point in different directions into one easily tracked sentiment reference point. The provider describes the methodology and Bitcoin focus on its Crypto Fear & Greed Index page.
Bitcoin matters here because it is the market around which this particular index is built. A trader looking at a smaller token should therefore resist assuming the reading precisely captures conditions in that token’s market. An asset can have project-specific liquidity, custody, supply, technical or regulatory considerations that a Bitcoin-centered sentiment gauge does not describe.
The index is best understood as a measure of market temperature. It can show that behavior has become unusually defensive or unusually exuberant; it cannot explain every reason why participants are behaving that way.
How volatility, volume, dominance and search behavior become one reading
Alternative.me combines several inputs into its score: Bitcoin volatility, market momentum and volume, social-media activity, Bitcoin dominance, Google Trends data and survey data. These categories are intended to capture both market action and signs of public attention or participation.
The two largest published components are volatility and market momentum/volume, each assigned a 25% weight in the methodology. That makes the index substantially responsive to how the Bitcoin market is moving and trading, rather than being solely a count of online discussion or search interest.
- Volatility addresses how sharply Bitcoin-market conditions are moving relative to the index’s historical reference points.
- Momentum and volume bring trading activity and market direction into the composite reading.
- Social-media activity and Google Trends provide indicators of public attention and discussion.
- Bitcoin dominance adds information about Bitcoin’s position relative to the wider crypto market.
- Survey data is also listed in the provider’s methodology.
These inputs should not be read as independent votes that all need to point the same way. They are ingredients in a composite. A jump in searches, for example, does not by itself establish greed or fear; its contribution sits alongside volatility, trading behavior and the other inputs.
Nor does the published component list reveal the full experience of every market participant. It does not turn a score into a balance-sheet analysis, a review of a protocol’s security, or a measure of an investor’s financial circumstances. The published methodology is more narrowly about synthesizing specified indicators of market behavior and attention.
Why the score compares today with 30- and 90-day market behavior
A daily price move does not provide a complete account of sentiment. The index compares current market behavior with historical reference periods that include 30-day and 90-day averages, according to Alternative.me. That comparison provides context for whether current volatility, momentum or other behavior is unusually strong relative to more recent conditions.
Consider two hypothetical Bitcoin declines of the same size. If one occurs after a quiet period with comparatively subdued movement, it may look very different in the index’s historical framework from an equal decline during an already turbulent stretch. The point is not that either scenario predicts the next move. It is that the score is designed to assess present conditions against a recent baseline, rather than react to one price change in isolation.
This is also why a reader should avoid treating the index as a price chart with a different label. Price is one expression of market activity. The index incorporates price-related behavior through inputs such as volatility and momentum/volume, but it also draws on dominance and attention-related measures.
Historical comparison can make a reading more interpretable over time. A score seen in isolation tells a reader where the gauge stands that day; a sequence of past readings may better show whether sentiment has been persistently cautious, rapidly shifting or remaining elevated. It still does not establish a causal explanation for those changes.

How to read extreme fear and extreme greed without treating them as signals
Extreme readings are where the index attracts the most attention. Alternative.me frames extreme fear as a possible sign that investors are excessively worried, while extreme greed can be a possible warning that the market is due for a correction. Those are behavioral interpretations, not promises of a reversal.
A practical way to use a reading is to put it in sequence:
- Check the day’s numeric value and classification.
- Compare it with recent readings to see whether sentiment is changing or merely remaining at an extreme.
- Review the relevant market conditions and asset-specific facts separately.
- Use the sentiment reading as context, not as the final decision rule.
For example, an extreme-fear reading may flag a period in which worry is unusually pronounced. A contrarian reader may regard that as a reason to look more closely at whether selling has become indiscriminate. It is not proof that the selling has ended, that an asset offers value, or that losses cannot continue. The same discipline applies to extreme greed: it may warrant more scrutiny of exuberant conditions, but it does not dictate that prices must immediately fall.
The wider fear-and-greed concept rests on the view that emotion can move market prices away from fundamentals: excessive fear may depress prices and excessive greed may inflate them. The difficult question is timing. Sentiment can remain fearful or greedy longer than a participant expects, and an index cannot settle that question on its own.
A crypto Fear & Greed reading is not CNN’s stock-market index
CNN’s traditional-market Fear & Greed Index uses seven stock-market indicators. Alternative.me’s Crypto Fear & Greed Index is a Bitcoin-focused composite, so the two readings describe different asset markets through different methodologies.
Both indexes use the language of fear and greed, but that shared vocabulary does not make them interchangeable. The crypto reading draws on its own inputs and historical reference behavior, whereas the stock-market reading concerns conditions relevant to equities.
Comparison is therefore conceptual rather than numerical. Each framework attempts to summarize how emotion and market behavior may interact, and the underlying data, assets measured and score construction set the limits on what its number can reasonably indicate. A matching pair of readings would not create one common signal; a mismatch would not by itself show that either reading was wrong. CNN outlines its methodology on its Fear & Greed Index page.
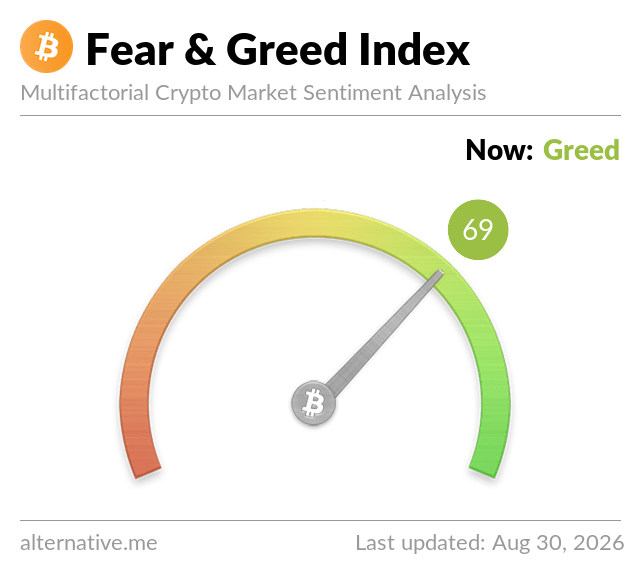
Official self-updating Crypto Fear & Greed Index gauge showing the current score and sentiment classification. — Source: Alternative.me
Where to check the index and what it leaves out of an investment decision
Alternative.me updates the Crypto Fear & Greed Index daily. It also makes historical readings and an API available; the API documentation lists a numeric value, a classification such as Fear or Greed, and a timestamp among the returned fields.
A current score can be examined against preceding readings. The history provides context rather than a reliable forecast, while the daily cadence leaves out some intraday changes in market mood.
Sentiment is only one part of a crypto-asset decision. Liquidity, custody arrangements, leverage, valuation and an individual’s risk tolerance can also be material. The U.S. Securities and Exchange Commission says crypto assets can be exceptionally volatile and speculative and that investors face a significant risk of loss; its Investor.gov alert is a reminder that the gauge cannot replace broader due diligence.
As Alternative.me’s methodology defines it, the index identifies the prevailing emotional backdrop in the Bitcoin market. That makes it a context indicator, not a standalone way to determine value, resolve uncertainty about future prices or tailor a decision to a particular investor.
Frequently Asked Questions
What score means fear or greed on the Crypto Fear & Greed Index?
Alternative.me uses a 0–100 scale, with 0 indicating extreme fear and 100 indicating extreme greed. The provider also supplies a classification alongside the numeric value.
Does the Crypto Fear & Greed Index cover every cryptocurrency?
No. Its reading can offer broad context for crypto conditions, but Alternative.me’s index is primarily focused on Bitcoin-market sentiment rather than serving as a tailored measure for every token or project.
Does extreme fear mean it is time to buy crypto?
Not by itself: while extreme fear can indicate unusually high worry and prompt further research, it neither guarantees a recovery nor rules out further losses.
How often does the index change?
The index is updated daily. A daily reading is therefore better viewed as a recurring market-context measure than an intraday trading tool.
Where can I find past Crypto Fear & Greed Index readings?
Alternative.me provides historical values on its index service and through its API. API responses include the score, sentiment classification and timestamp for returned observations.