

Altcoin open interest is the total number of altcoin futures contracts that remain outstanding rather than having been closed, offset, delivered or fulfilled. It measures the amount of active derivatives exposure in a market. It does not, by itself, show that traders are collectively bullish or bearish.
That distinction matters because every futures contract has a buyer and a seller: one long position and one short position. Only one side of the matched contract is counted in open interest. The aggregate long open interest therefore equals aggregate short open interest, even when one side of the market may be under greater pressure. CME Group and the U.S. Commodity Futures Trading Commission describe open interest as a count of outstanding contracts, not a tally of a market's net directional conviction.
What altcoin open interest counts—and what it cannot tell you
Altcoin open interest in crypto derivatives generally means open perpetual or dated futures positions tied to tokens other than bitcoin. Reported in contracts or dollar value, it is a count of positions still outstanding until offset, delivered, fulfilled or otherwise settled. Because every futures contract has one long and one short, a corresponding long-short pair adds one contract to open interest, not two. For example, a new long SOL futures position matched with a new short raises open interest by one contract; closing the pair lowers it by one.
That count does not identify a market as net long or net short, because it records live contracts rather than a standalone directional vote. A rising total can occur during an advance, a decline or limited price movement. Directional analysis therefore also uses price behavior, funding, futures basis, position data or trader-category data.
Open interest versus volume
Open interest and trading volume answer different questions. Volume counts contracts traded over a specified period. Open interest counts contracts still outstanding at a point in time. A contract can trade several times during a day and add substantially to volume without remaining open by the end of that period.
When both parties create a new futures position, open interest can rise. When existing positions are closed, it can fall. As CME Group's futures guide notes, rising open interest can indicate that new positions are entering the market, while falling open interest often reflects position closure.
Neither relationship supplies a complete explanation for a move. High volume may reflect rapid turnover, profit-taking, hedging or forced exits. Rising open interest says that exposure is being added, but not which side has the better trade or whether those new positions are sustainable. This is why a chart of open interest is more useful as a participation and leverage measure than as a standalone trading signal.
Reading open interest with price, funding, basis and market size
Price and open interest together show when exposure is entering the market, not what that exposure means. A simultaneous rise can accompany an advance, while rising open interest during a price decline also indicates new exposure. The aggregate total cannot distinguish principally between fresh shorting, long accumulation, hedging or a mixture of activities.
For additional context, funding is a periodic payment mechanism used in many perpetual-futures markets, and basis is the relationship between a futures price and the underlying market. They help frame futures pricing and positioning around spot, but position-level data is still needed for a more specific reading.
Raw scale changes the significance of the number: a large open-interest value may be routine for a highly capitalized asset and more consequential for a smaller market. The CFTC places open interest alongside price and volume in assessing participation and liquidity, not as a standalone bullish or bearish signal. It also notes that higher open interest can leave more positions vulnerable to a forced unwind, as described in its discussion of open interest.
Another view compares derivatives exposure with market size. In a Coinbase Institutional chart, altcoins mean all tokens excluding BTC, and altcoin contracts are measured in dollar value for every $1 of BTC derivatives open interest. Combined with altcoin market capitalization, the comparison tracks whether derivatives activity is expanding or contracting relative to the underlying altcoin market.

How margin creates liquidation risk
Open interest becomes especially relevant when positions use margin. Margin allows a trader to control a futures position with less capital than the position's full value. That leverage magnifies the effect of price changes on the equity supporting the trade.
A position becomes vulnerable when account equity or margin falls below the required maintenance margin. At that point, an exchange may automatically close part or all of the position to manage risk. Coinbase's risk-management guidance identifies leverage, position size, margin, available balance and contract rules among the inputs that affect liquidation prices.
The basic sequence is straightforward. A trader opens a leveraged position; the market moves adversely; the equity available to support that position declines; and a maintenance-margin threshold can trigger an automatic reduction or closure. Closing can itself require market transactions, which matters when many traders are approaching similar risk thresholds at once.
Liquidation is generally assessed using a mark price rather than simply the last traded price. The calculation and process differ by venue. Bybit's contract documentation, for example, notes both the use of mark price and the fact that higher leverage places a liquidation threshold closer to the entry price. There is therefore no universal formula that can reliably convert an aggregate altcoin open-interest figure into one liquidation price.
Why high altcoin open interest can amplify a forced unwind
High open interest is not inherently unhealthy. It can accompany deeper participation and greater activity in a futures market. But it also means more outstanding contracts exist, and some portion may be supported by margin that becomes insufficient after an adverse move.
The risk is most acute when leverage is concentrated and price begins to move through levels that pressure one side of the market. Long positions can face liquidations during a sharp decline; short positions can face them during a sharp rise. Forced closures may add buying or selling into the existing move, potentially intensifying it.
An aggregate reading of open interest can flag vulnerability, but it cannot map a precise liquidation cascade or identify the exact point at which this process begins. That limit reflects differences among traders’ leverage, collateral balances, entry levels and contract types, as well as exchanges’ maintenance-margin schedules, mark-price methodologies and liquidation rules.
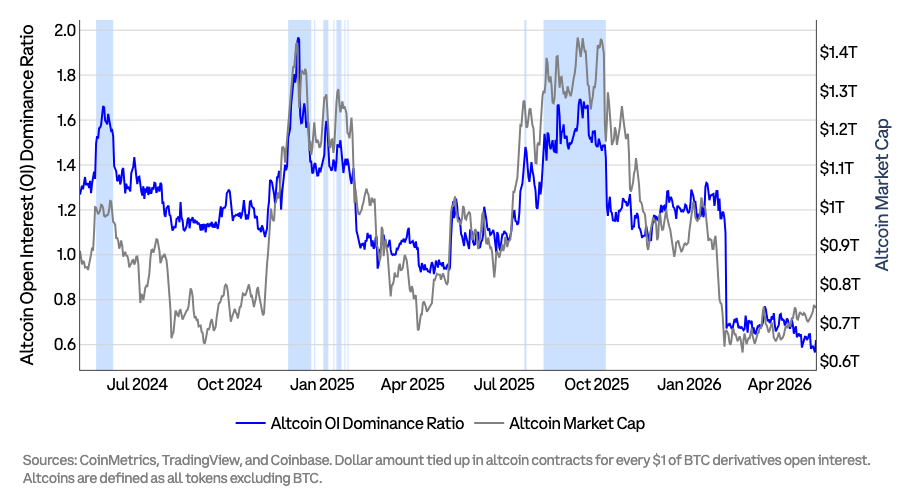
Altcoin open-interest dominance ratio versus altcoin market capitalization; source note identifies CoinMetrics, TradingView, and Coinbase. — Source: Coinbase Institutional
Practical sequence: interpreting open interest during a price move
Suppose an altcoin's price is rising and its open interest is rising at the same time. The immediate conclusion should be limited: outstanding futures exposure is increasing during the rally. That can reflect strengthening participation, but it can also build a more crowded and leveraged market.
- Start with price and open interest. Establish whether exposure is being added or removed as the market moves. A rise in open interest points to contracts remaining outstanding, unlike a volume spike that may merely show heavy trading.
- Check funding or basis. These measures provide context on the futures market's pricing and positioning conditions. They do not transform total open interest into a direct count of bullish or bearish traders.
- Put the figure in proportion. Compare exposure with the asset's market scale and, where relevant, with BTC derivatives exposure. A relative approach can be more informative than a raw dollar number.
- Review venue-specific liquidation conditions. Mark price, leverage, maintenance margin and contract rules determine how close positions may be to forced closure.
If price then reverses, the earlier rise in open interest becomes relevant as a possible source of unwind pressure. Yet the available data still may not show how much exposure belongs to longs, shorts, hedgers or traders using different collateral. The appropriate reading is conditional: elevated open interest can increase the pool of positions vulnerable to forced closure, not guarantee that liquidations will occur or determine their direction.
Frequently Asked Questions
Is rising altcoin open interest bullish?
No. It indicates that more futures contracts are outstanding, not that longs exceed shorts. Price, funding, basis and other positioning information are needed for directional context.
Does open interest show whether there are more longs than shorts?
No. Every open futures contract has a long and a short, so aggregate long and short open interest are equal by construction.
How does open interest differ from futures volume?
Volume measures contracts traded during a period. Open interest measures contracts that remain active after trading, so it is a stock of outstanding exposure rather than a record of activity over time.
Does high open interest guarantee a liquidation event?
High open interest can mean a larger pool of leveraged positions may be exposed to a sharp move, but it does not by itself determine whether liquidations occur. That depends on price changes, margin and each exchange's rules.
Why can liquidation prices differ across exchanges?
Venues can use different mark-price methods, maintenance-margin requirements and contract specifications. A trader's leverage, position size, margin and available balance also affect the threshold.