

Ripple (XRP) and Stellar (XLM) Experience Significant Gains: Insights on Market Movement and Price Patterns
Ripple (XRP) and Stellar (XLM) are both showing strong upward movement on Friday. Could this signal the beginning of more gains, and have these layer 1 blockchain tokens reached their lowest point following the recent downturn in the crypto market?
$XRP Accelerating Upwards
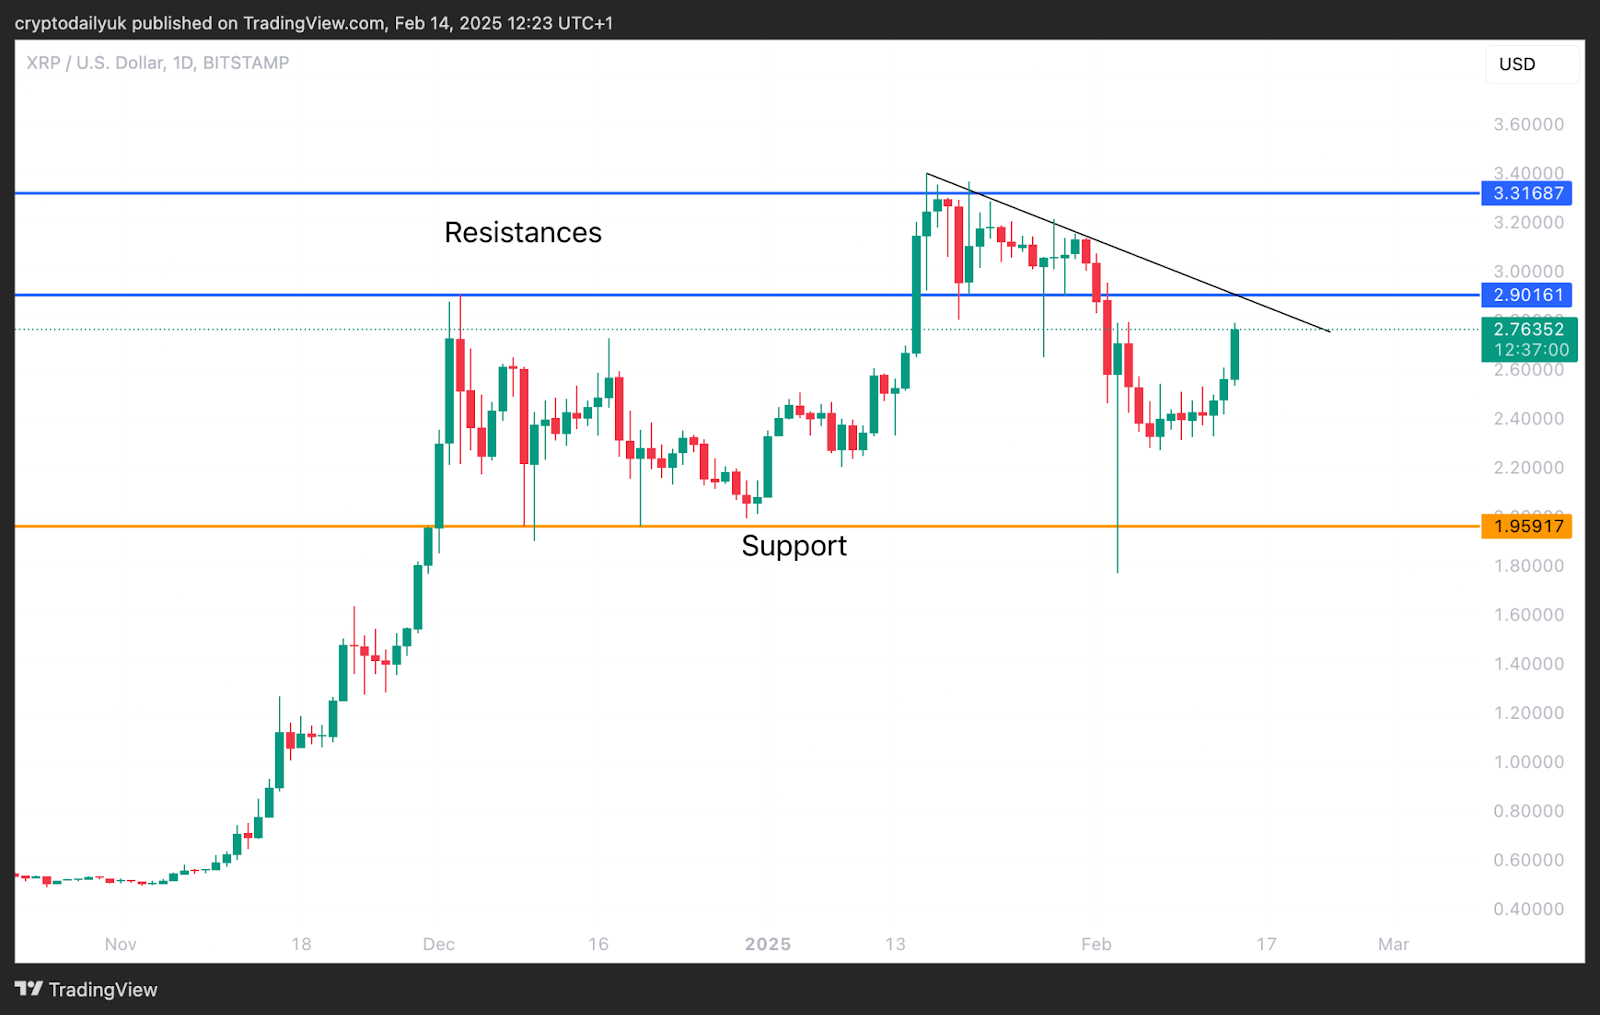
Source: TradingView
$XRP has risen over 8% today, showing renewed momentum. The daily chart indicates that a potential bottom occurred on February 3rd, evidenced by a long wick pointing to robust buying interest as the price hit the crucial $1.96 support level.
However, the path forward may not be entirely smooth. A horizontal resistance lies ahead, aligning with a descending trendline. If bulls manage to push the price past this barrier, a new local high might be achieved. Conversely, failure to break through could see the price dropping back to the $2.32 support level, and potentially further to the major horizontal support beneath it.
Analyzing $XRP's Mixed Macro Outlook
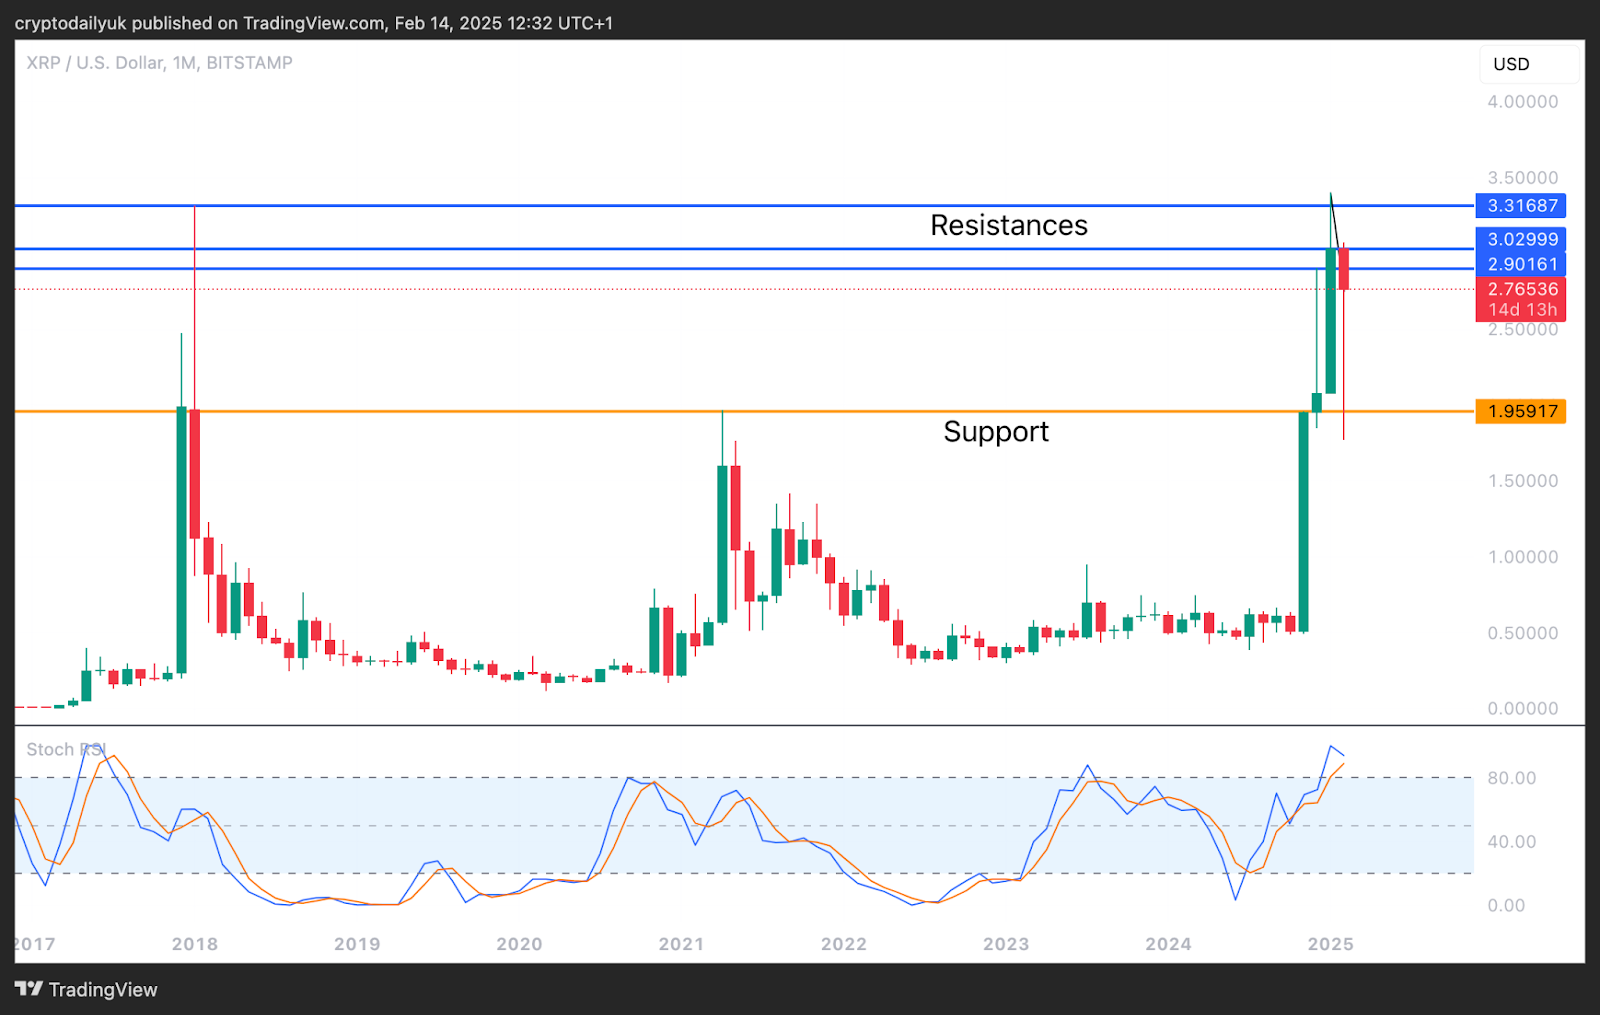
Source: TradingView
The monthly chart for $XRP presents a fascinating view. It seems that a price structure is developing above the significant horizontal support at $1.96, with the long wick affirming this level.
Nevertheless, the rapid price increase makes it challenging for the market to stabilize quickly. It's more likely that sideways consolidation will follow. The Stochastic RSI at the chart's base suggests potential downward movement as it approaches a crossover.
$XLM's Decline Since Last November
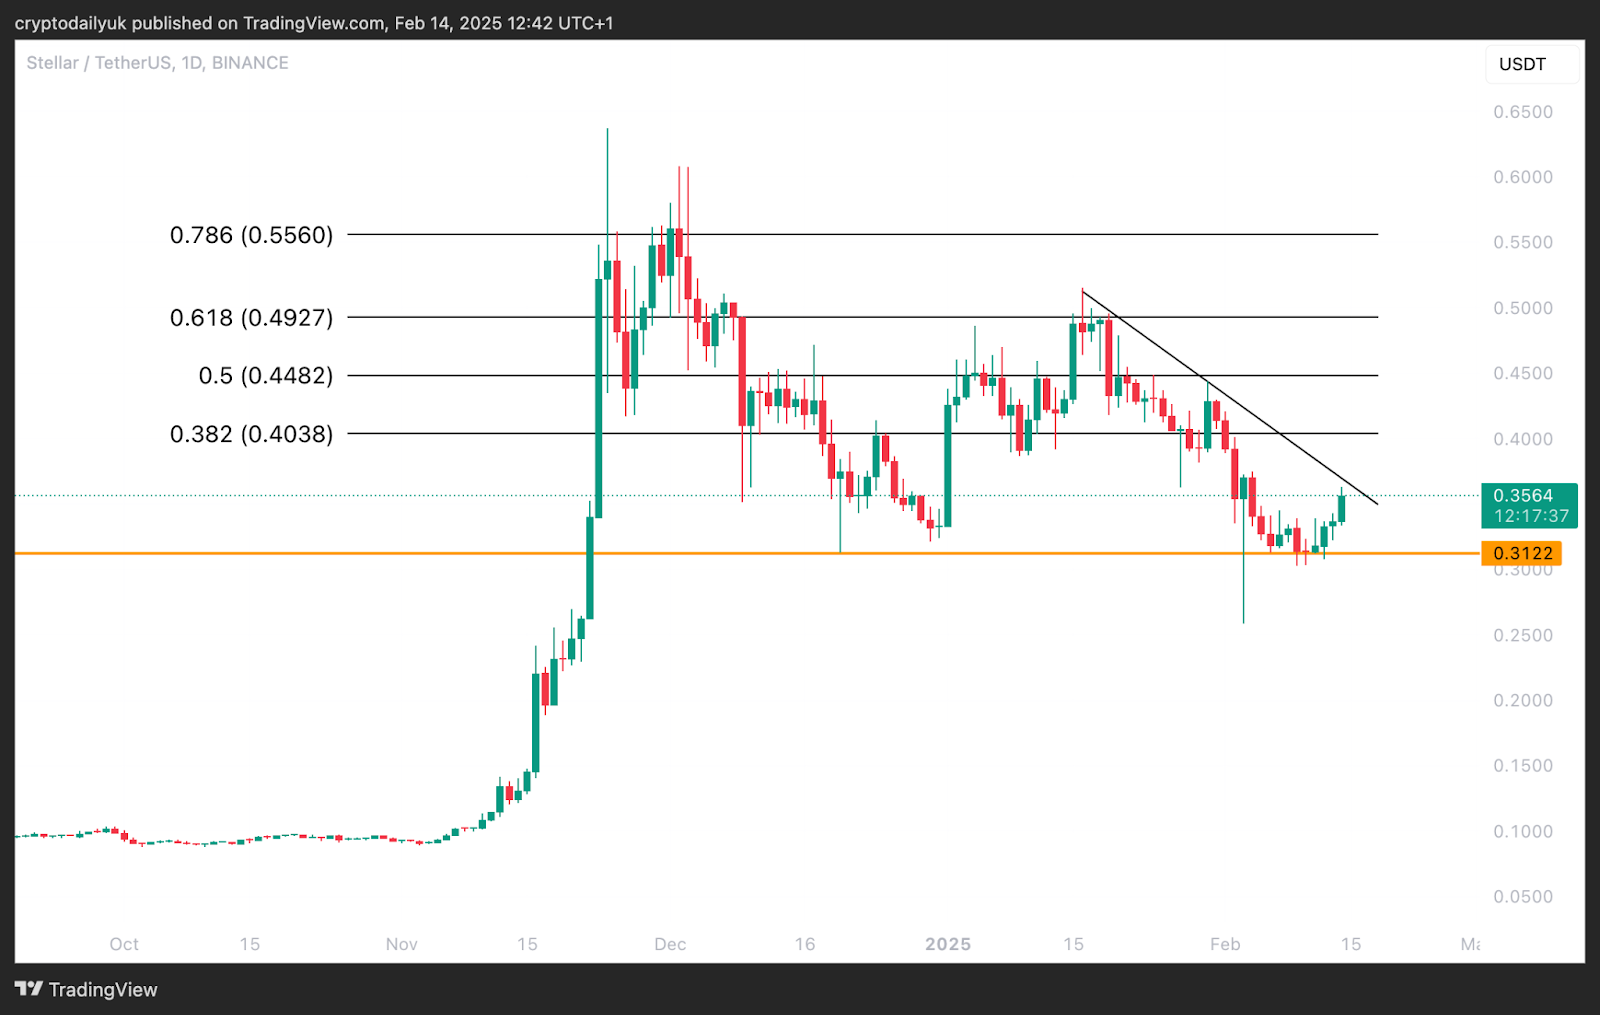
Source: TradingView
$XLM has been trending downward since November 2024, with a series of lower highs and lows bringing it back to the major support level of $0.31. For a trend reversal to begin, this bounce needs to push past current resistance and the descending trendline.
$XLM's Robust Horizontal Support Confirmed
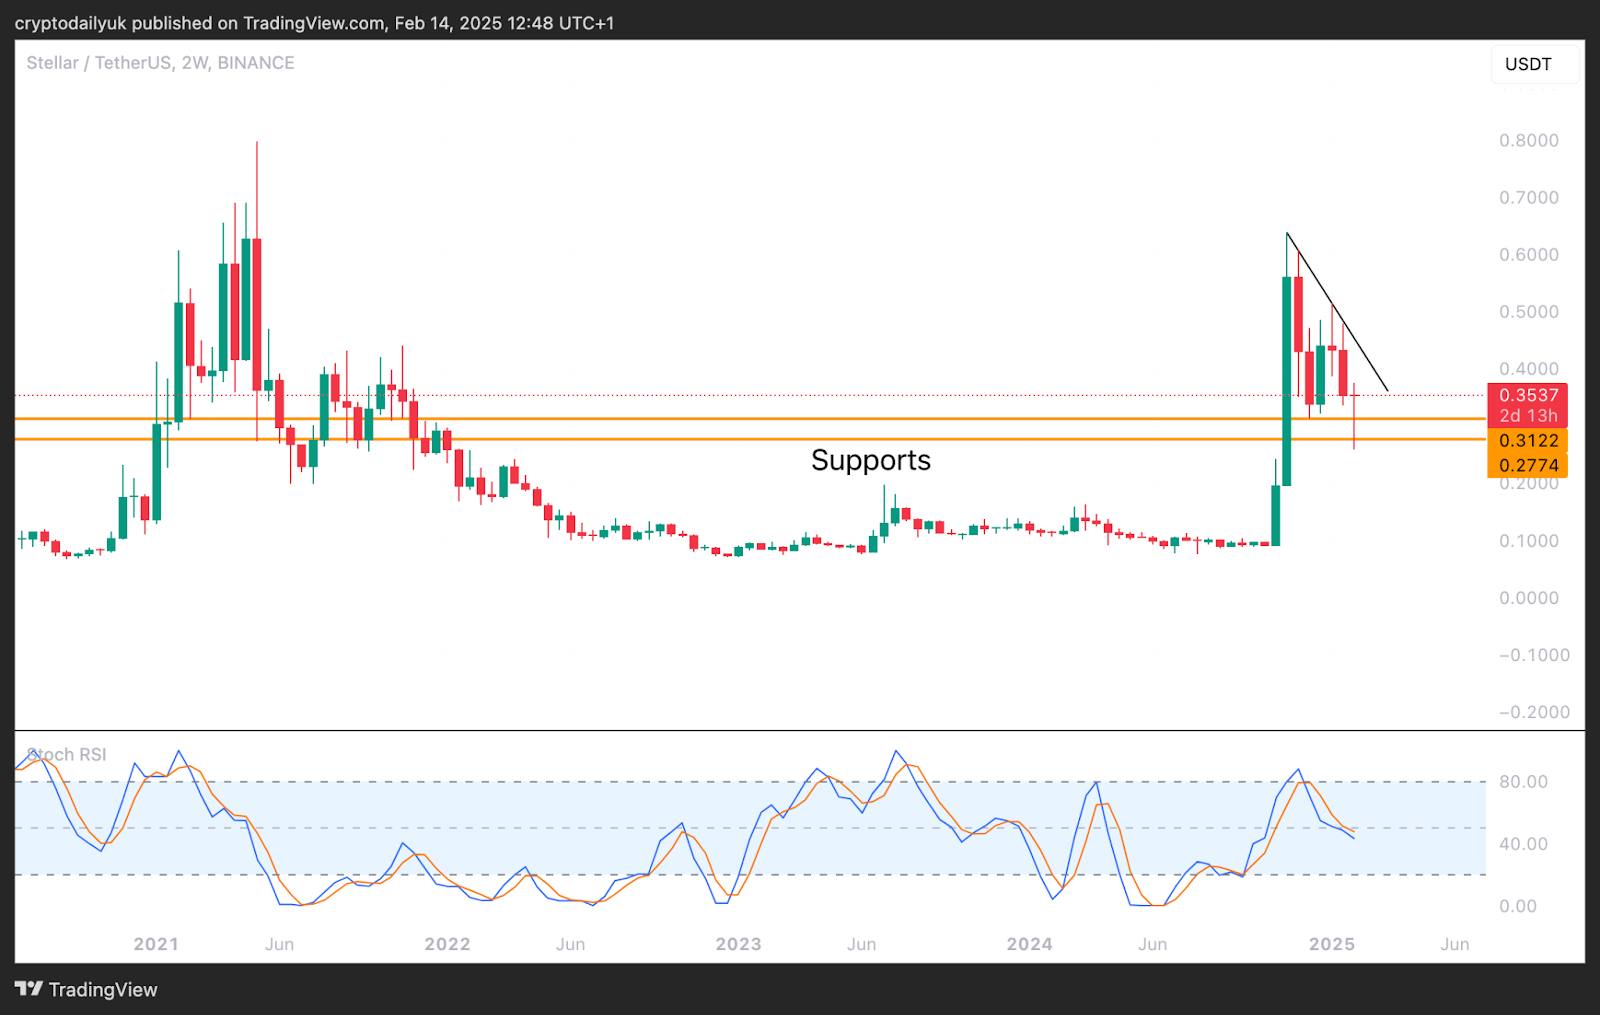
Source: TradingView
Examining the broader context for $XLM, it appears that the downtrend might be stabilizing. The current candle's long wick downwards underscores the strength of the underlying support.
Despite this, the Stochastic RSI at the chart's bottom indicates the lines are continuing to move downward past the midpoint, with just two days remaining for confirmation. This could pose a significant challenge, suggesting a potential extended phase of lateral price movement until the indicators either reach the bottom or bounce back from the 20.00 level.
Disclaimer: This article is provided for informational purposes only. It is not offered or intended to be used as legal, tax, investment, financial, or other advice.
Investment Disclaimer