
Table of Contents
- $SOL Set to Spearhead the Crypto Rally
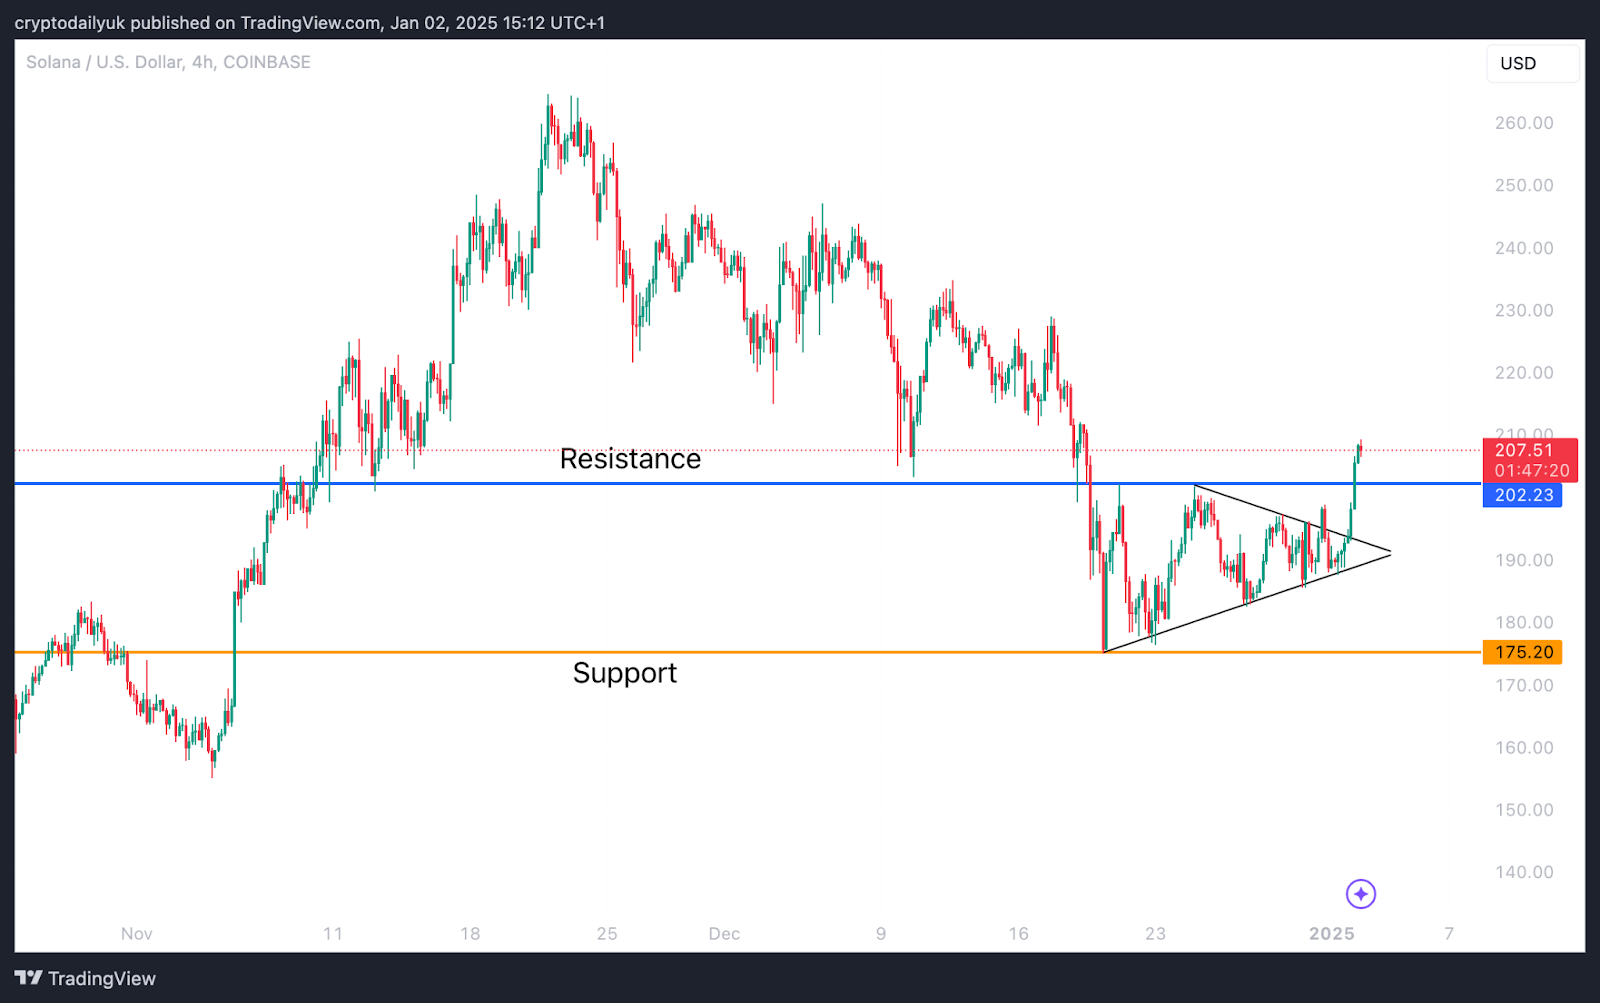
- Triangle and Key Horizontal Resistance Breakthrough
- $202 Level as a Potential Launchpad for $SOL's Next Bullish Phase
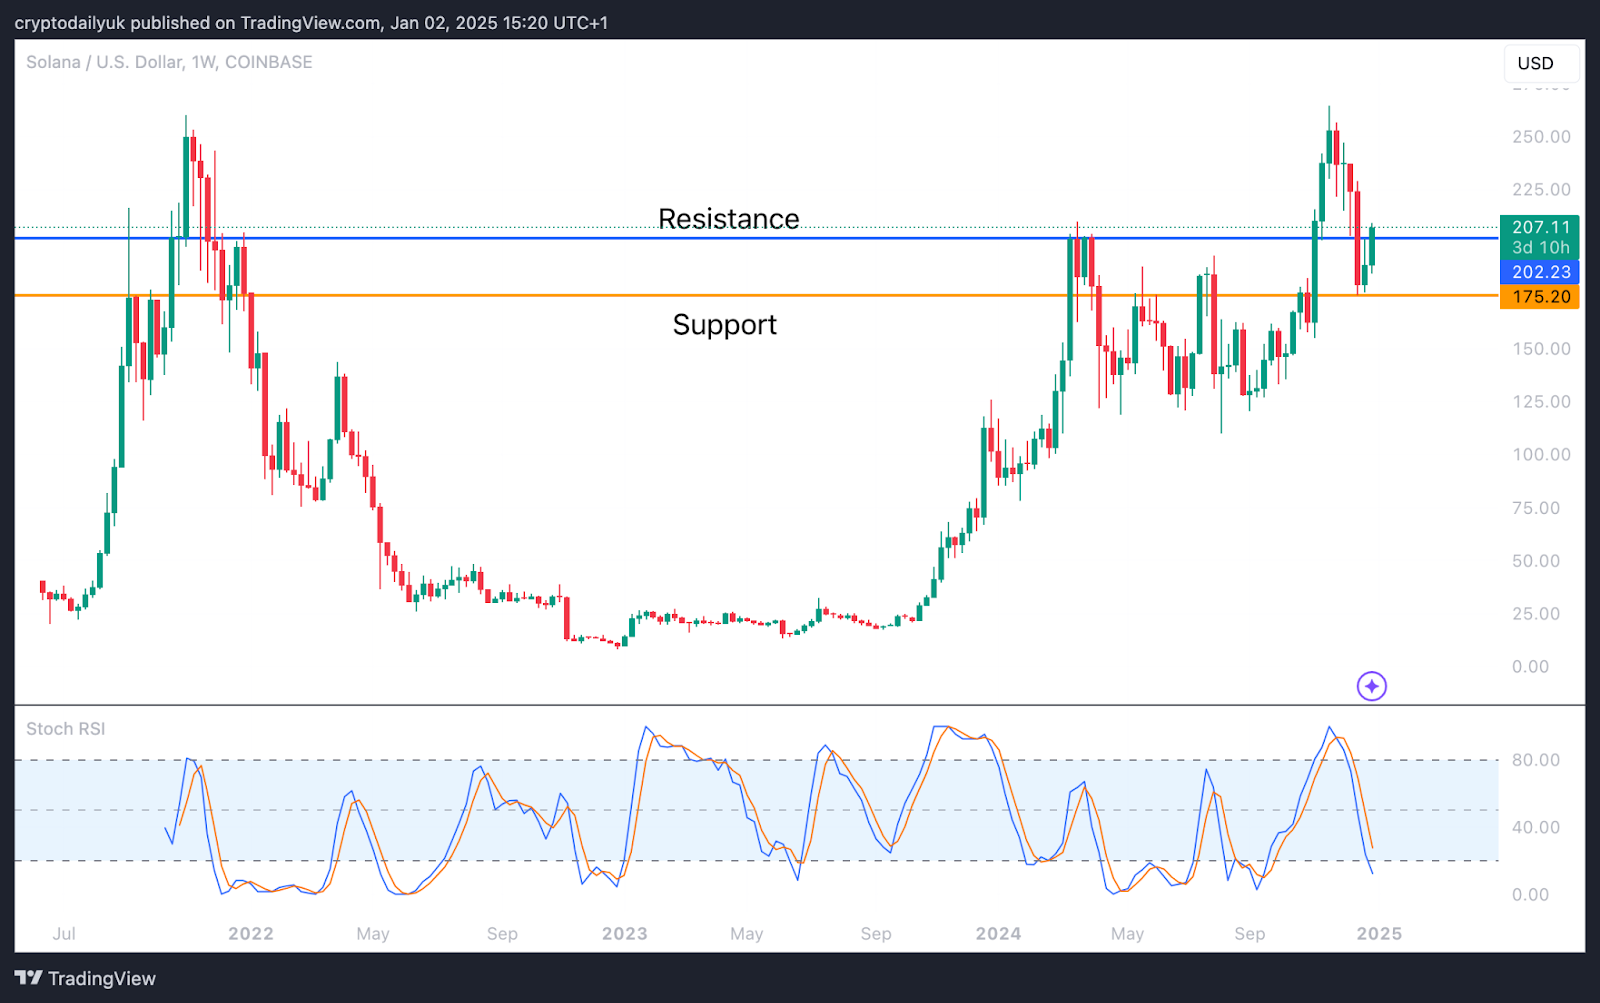
- On the lower part of the chart, the Stochastic RSI, an indicator of price momentum, shows that the lines are nearing their lowest points. When these lines reverse, with the faster blue line crossing above the slower orange line and both moving past the 20.00 mark, it could signal a strong momentum boost for the price.