
Solana (SOL) Price Alert: Facing Key Resistance - Will It Break Through?
The $SOL price has reached the most significant resistance point of this bull market. Will it experience a rejection, or could a break and confirmation above this level trigger its next potentially explosive phase?
Will it face rejection or achieve a breakthrough?
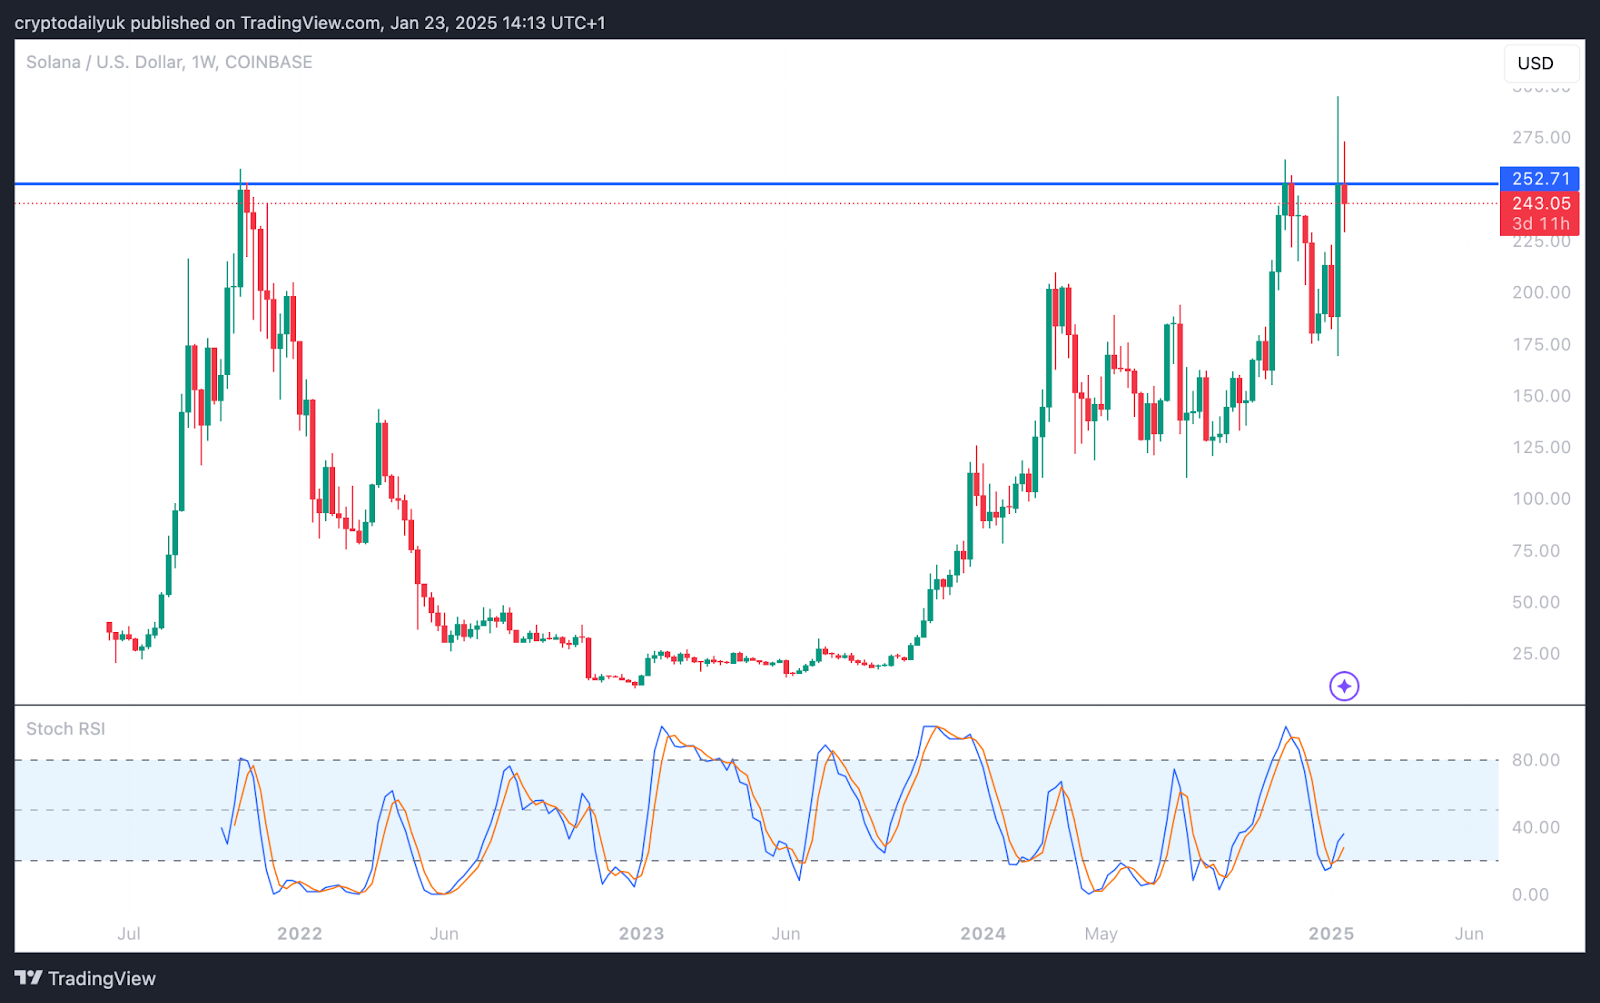
Source: TradingView
The weekly chart for $SOL, paired with $USDT (SOL/USDT), presents a significant concern. The major horizontal resistance at $252 essentially marked the peak of the previous bull market in 2021, and it caused $SOL to be rejected in the latter half of November. The price hit this level last week, creating a long wick, and there’s a possibility of another rejection this week.
Is this a scenario of repeatedly testing a stubborn barrier that will eventually break, or could it result in a definitive rejection, pushing the $SOL price into a deeper correction, or possibly worse?
One optimistic sign is the Stochastic RSI at the chart's bottom. A cross above the 20.00 level indicates strong upward price momentum. If you consider the cross-up on the 2-week chart as well, this suggests even greater potential for upward movement.
$SOL Nears Critical Point Against $BTC
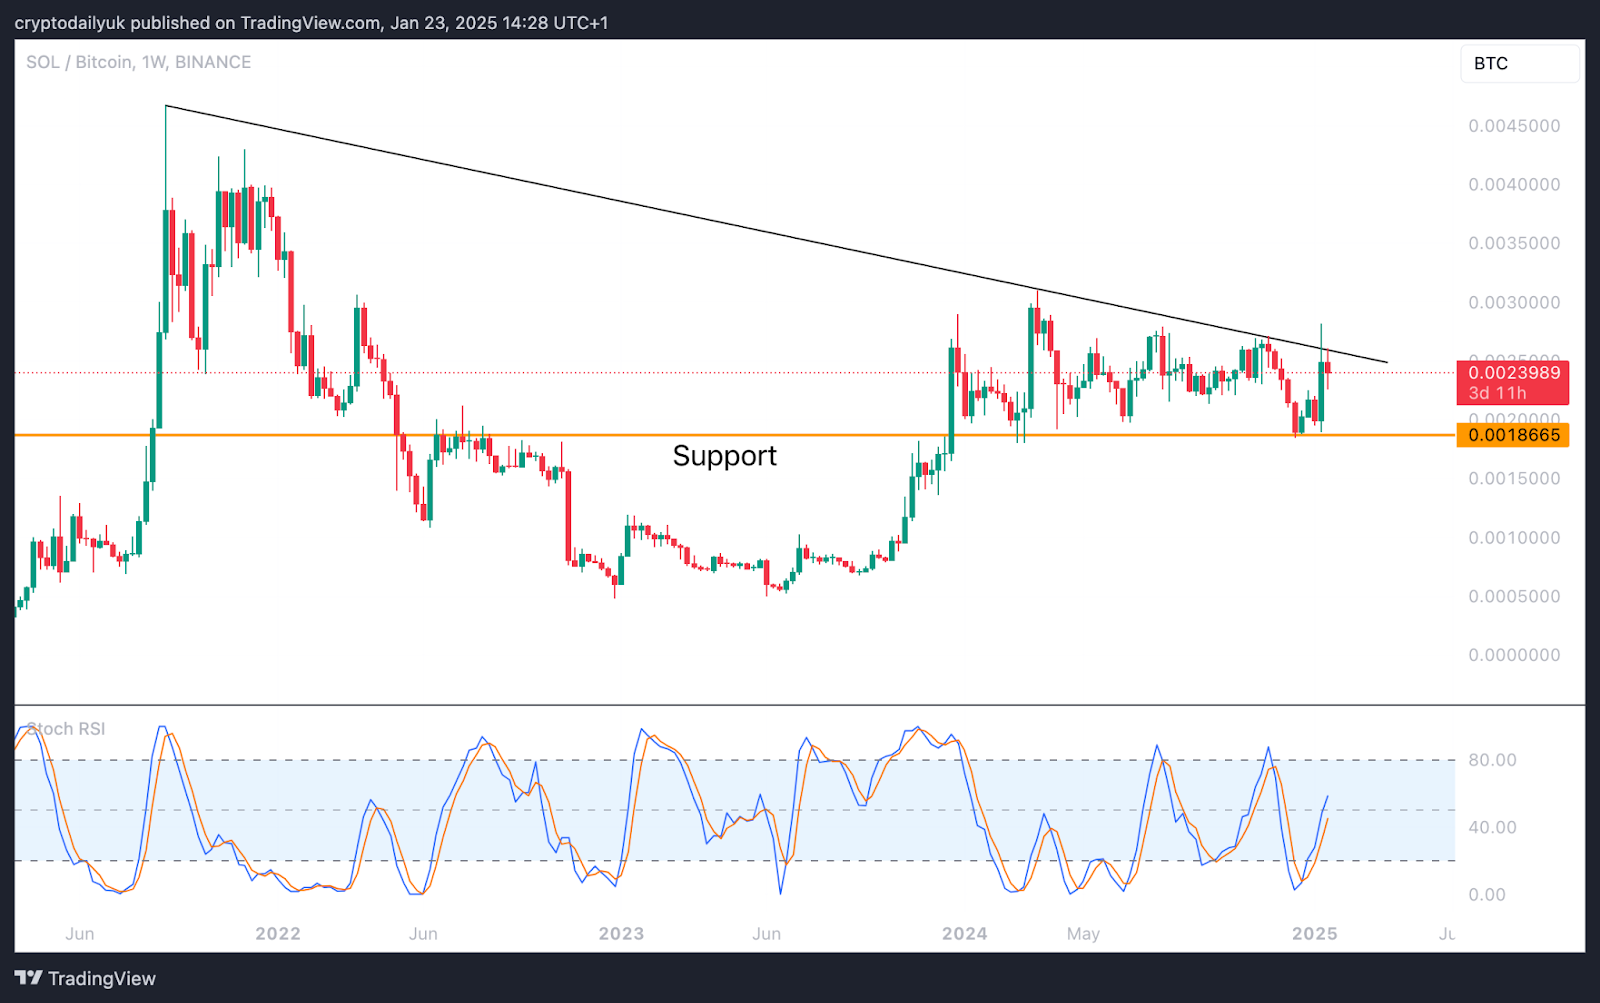
Source: TradingView
The SOL/BTC chart may be even more crucial than its US dollar counterpart. If $SOL fails to break out against $BTC, what incentive would there be to hold it through the final stages of this bull market?
The chart is remarkably clear. A descending trendline, dating back to early September 2021, is compressing the $SOL price movement into a narrowing range, caught between this trendline and the substantial horizontal support below.
One of these barriers—either the trendline or the support—must eventually yield. If viewed as a descending triangle, the probability of a breakdown increases.
Nevertheless, momentum for $SOL appears to be building, as indicated by the Stochastic RSI at the chart's base; this is mirrored on the 2-week chart as well.
Significant Horizontal Resistance on 2-Month Chart
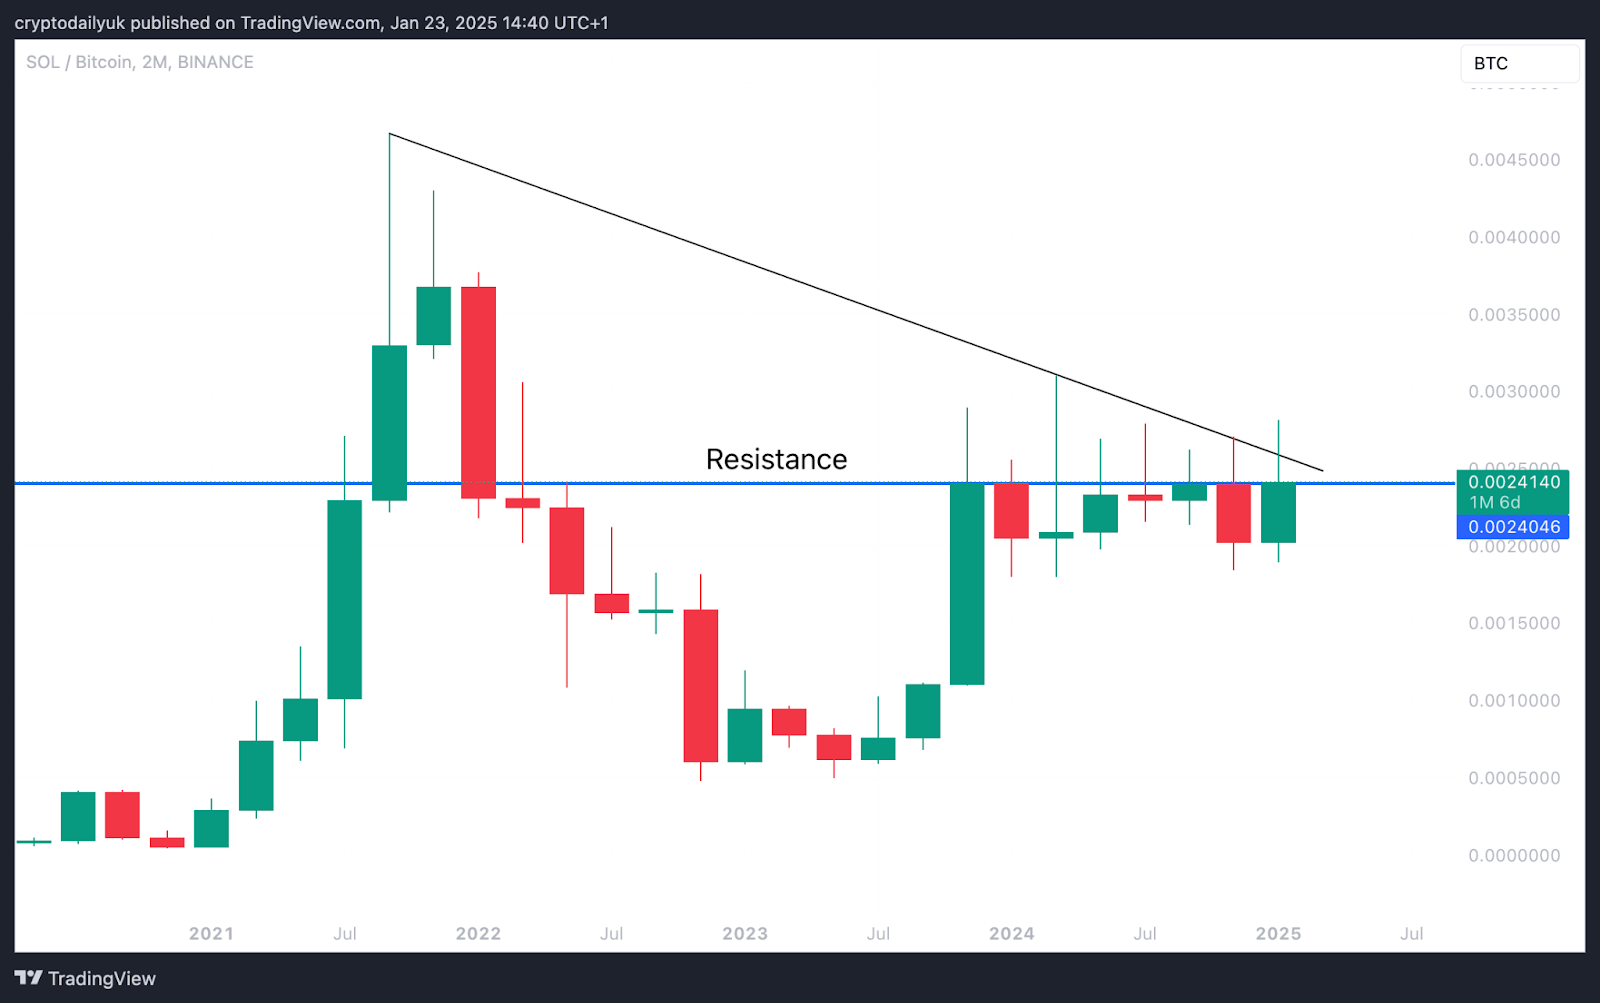
Source: TradingView
Zooming out to the 2-month chart for SOL/BTC reveals a substantial horizontal resistance. If this resistance isn't overcome in the coming month, the next 2-month period will confront both the resistance and the descending trendline.
This could potentially push $SOL back down, but if the bulls manage to break through, the upward momentum could be quite dramatic.
Disclaimer: This article is provided for informational purposes only. It is not offered or intended to be used as legal, tax, investment, financial, or other advice.
Investment Disclaimer