

Ripple (XRP) and Cardano (ADA) nearing a breakout moment
It seems that Ripple (XRP) and Cardano (ADA) are more than just a passing trend, as these veteran cryptocurrencies are on the cusp of breaking through to new peaks.
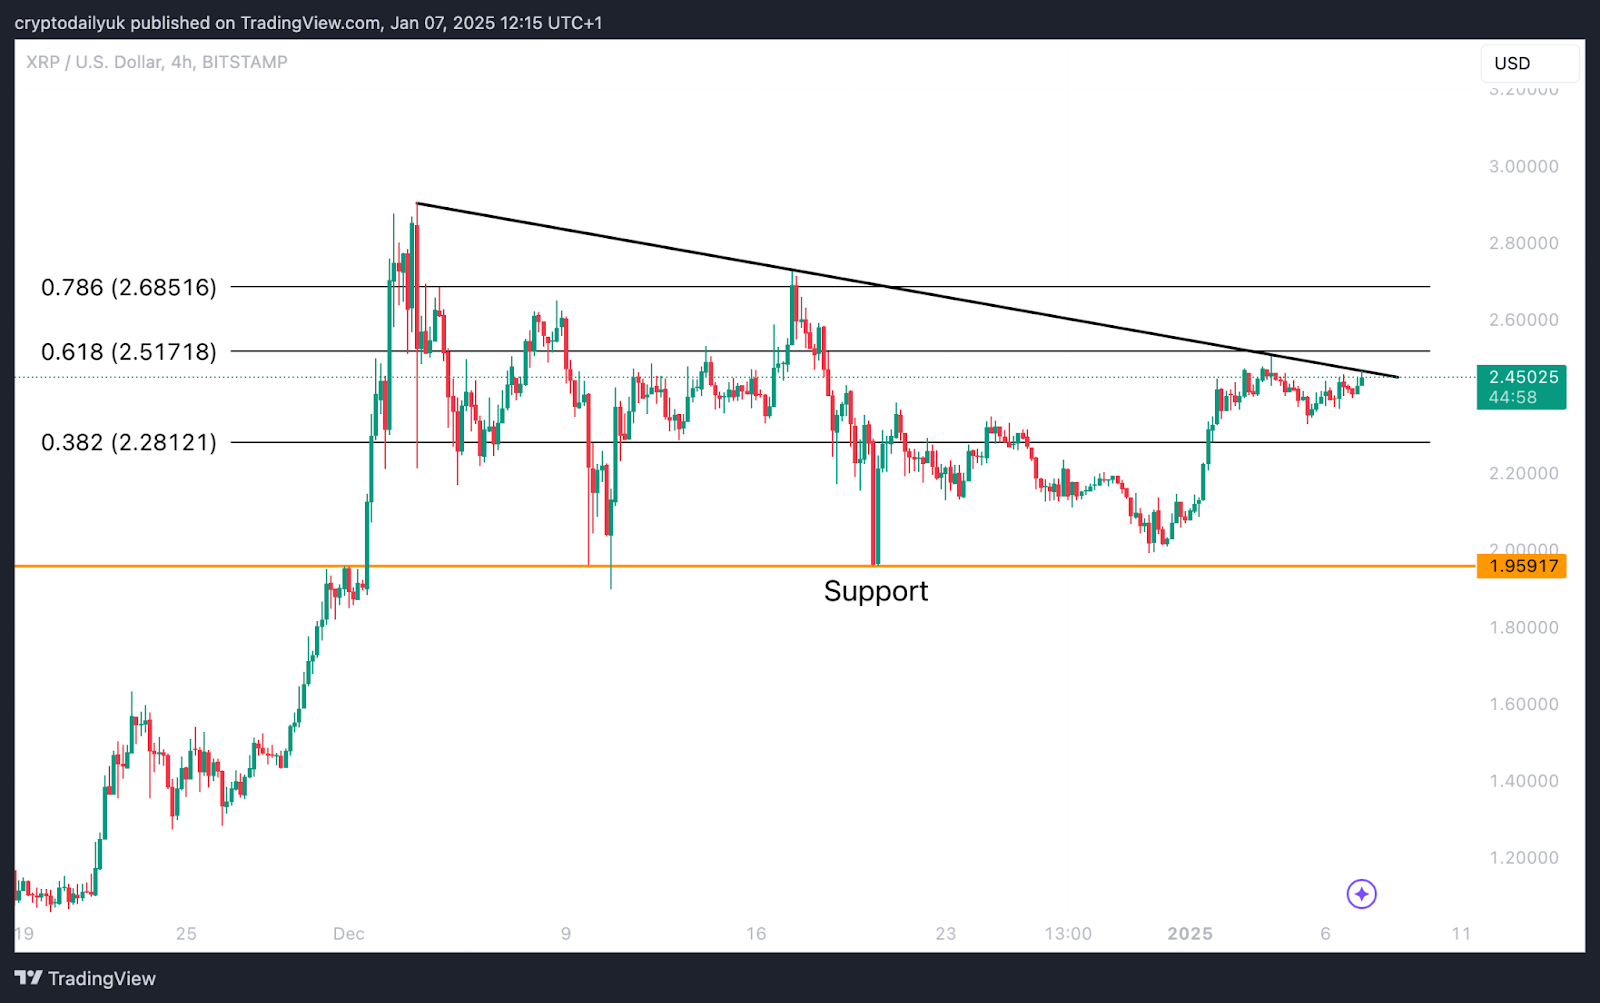
$XRP positioned at the descending trendline
Source: TradingView
$XRP (XRP/USDT) is currently positioned just below the descending trendline that has capped a sequence of lower highs. If the $XRP bulls manage to propel the price beyond this trendline and secure a confirmation above, prepare for the continuation of this impressive rally. Potential targets include $2.51, $2.68, and the local high at $2.90, should the breakout materialize.
Should the price face rejection at the descending trendline, the 0.382 Fibonacci level offers support at $2.28, with more substantial support at $1.96. Bulls are keen to prevent the ongoing formation of a descending triangle by achieving a breakout soon.
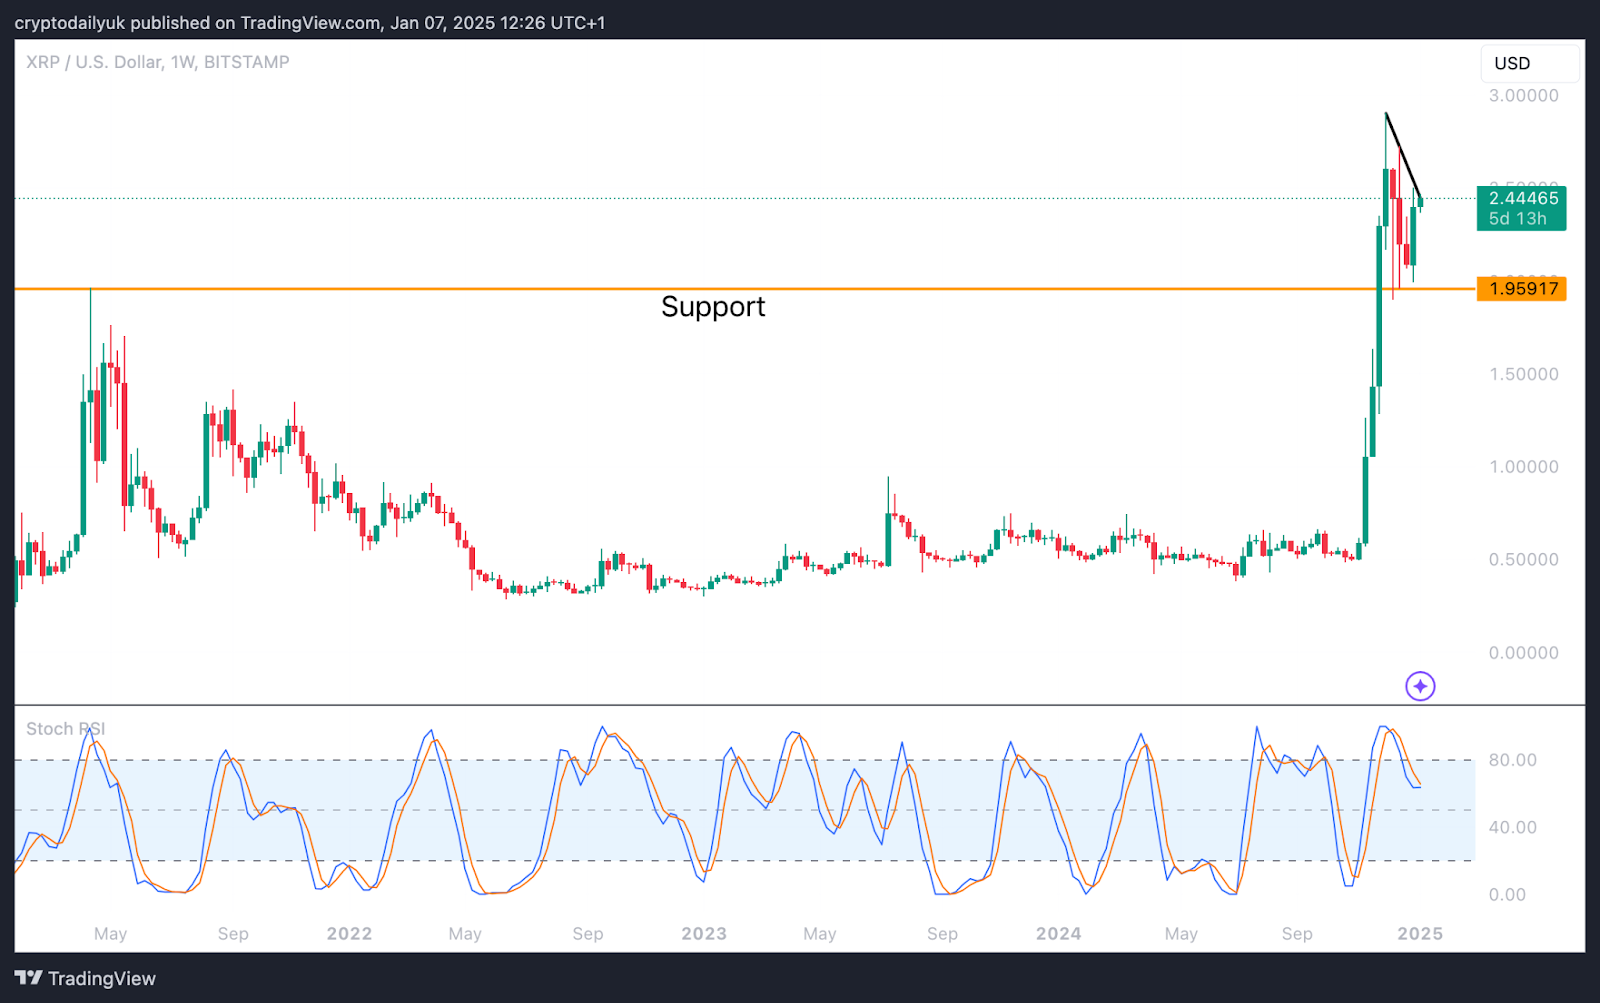
Key horizontal support beneath $XRP
Source: TradingView
The weekly chart for $XRP highlights the significance of the major horizontal support, which is built on the peak of a price surge dating back to April 2021. At the lower end of the chart, the Stochastic RSI is gearing up for a potential upward turn. This move is crucial for ensuring the breakout and continued upward movement.
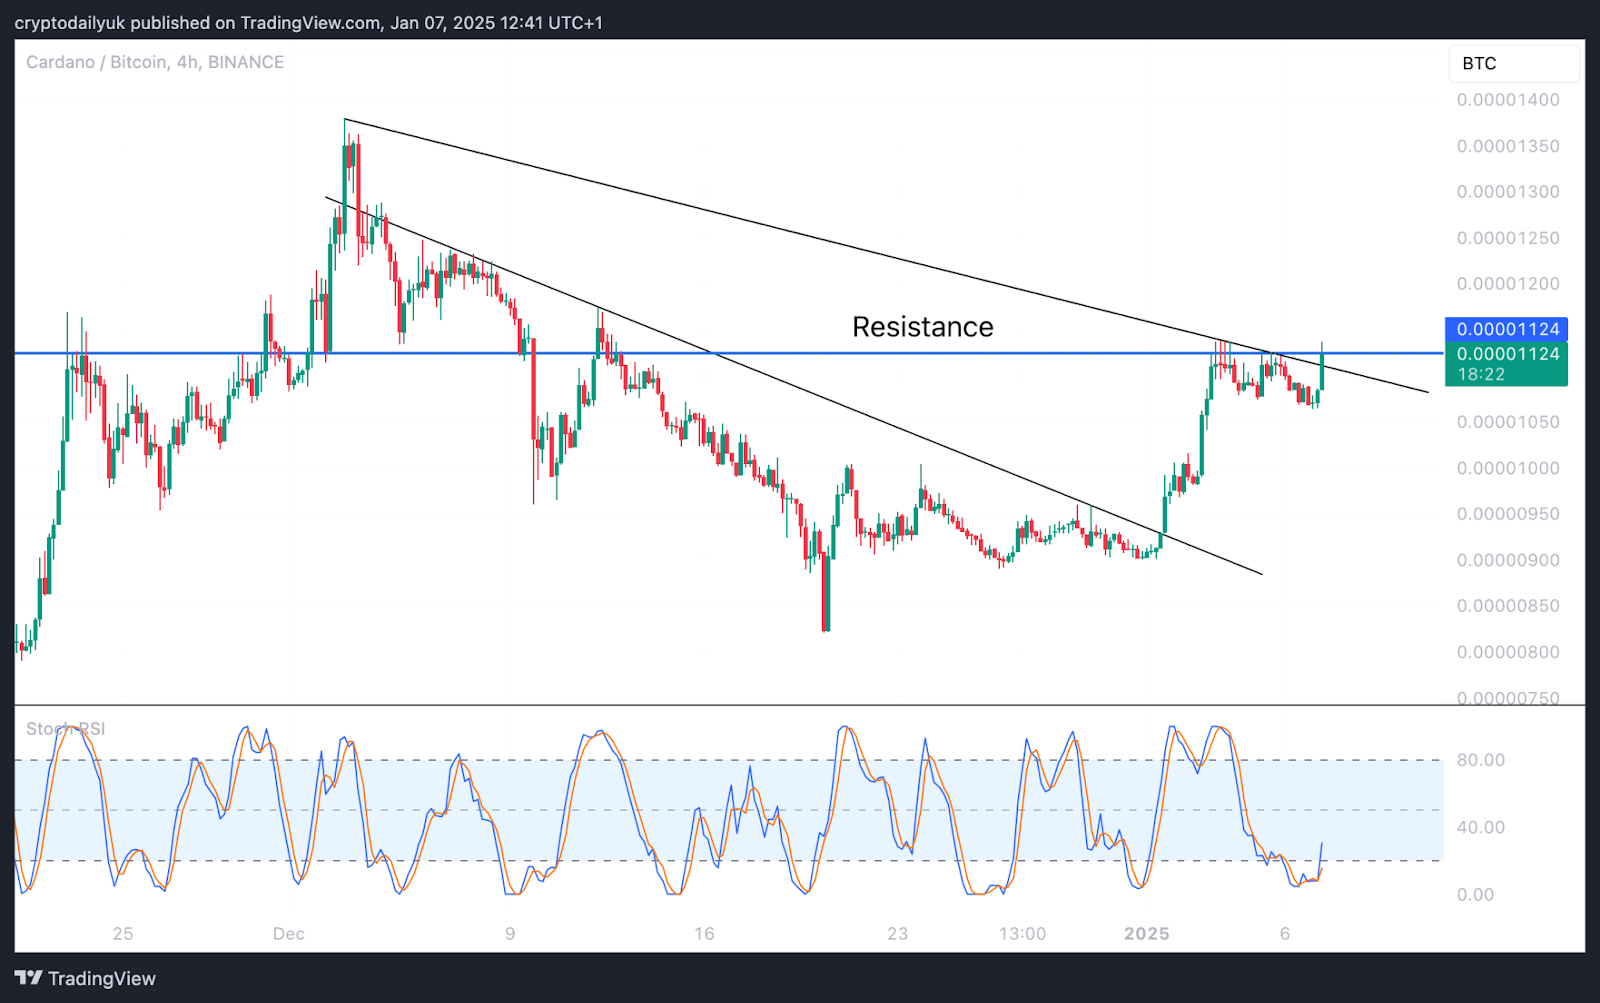
$ADA currently breaking out
Source: TradingView
The 4-hour chart for $ADA (ADA/USDT) above illustrates the current effort to surpass the major resistance level at $0.00001125. It appears the descending trendline has been overcome, with bulls and bears now contending over the horizontal resistance level.
There is ample room for growth in the Stochastic RSI indicator lines at the chart's bottom, suggesting that upward momentum could favor the bulls in this contest.
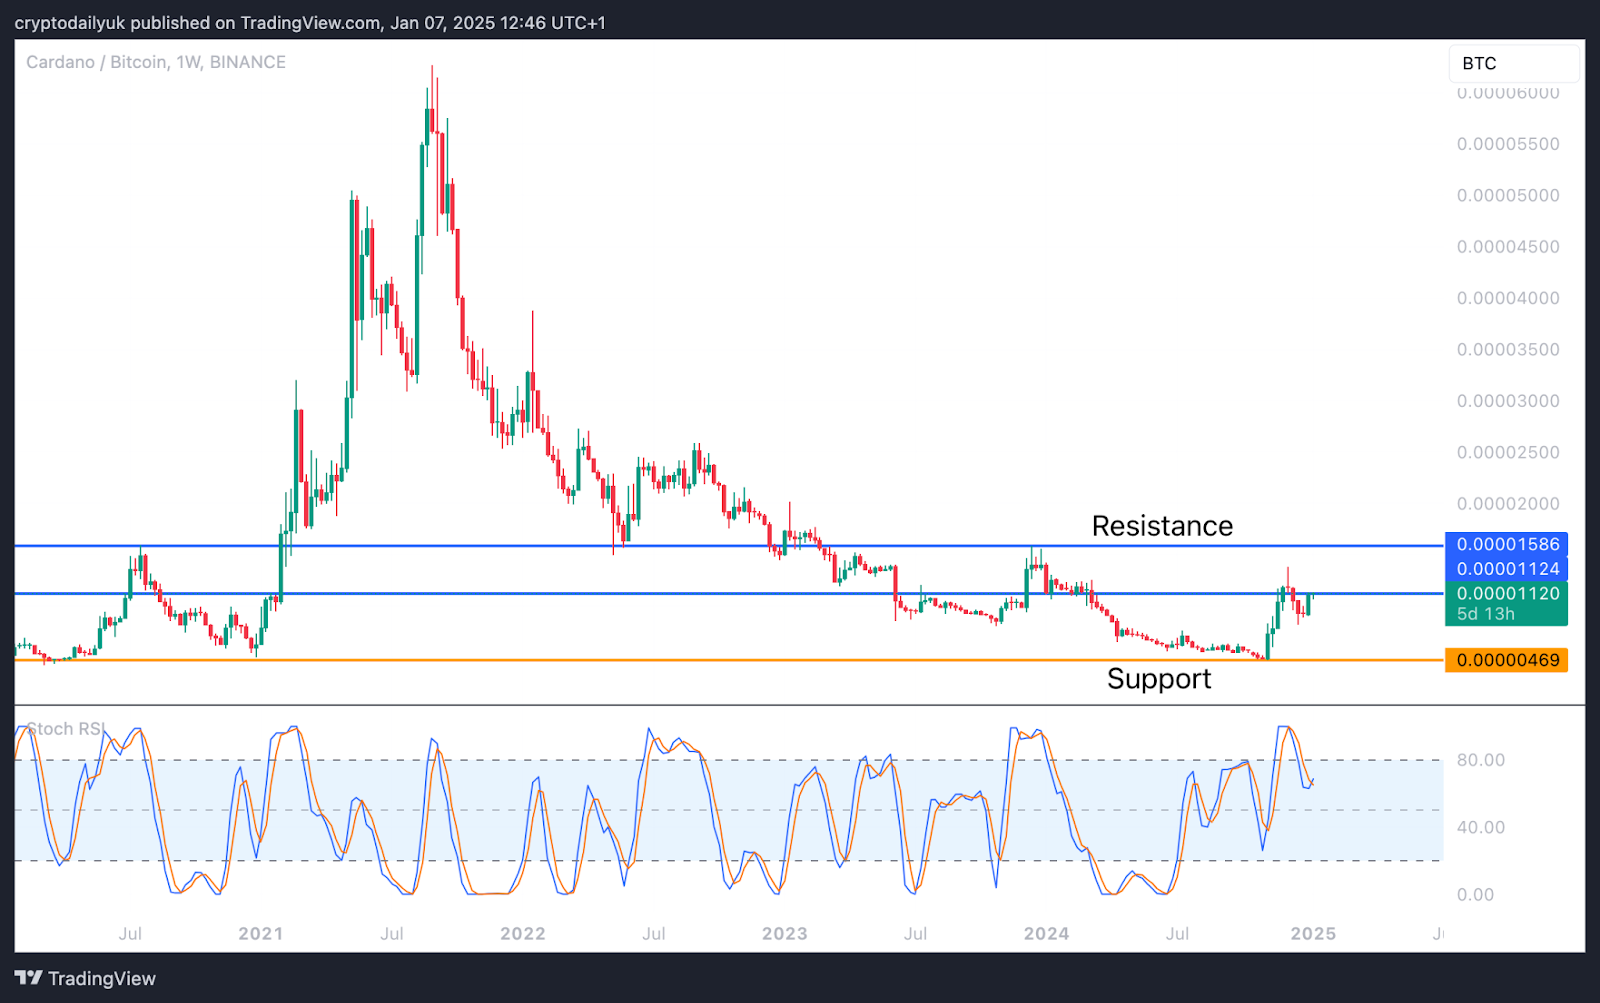
$ADA bulls face challenges to reverse the downtrend
Source: TradingView
Taking a broader view with the weekly time frame, the outlook for $ADA seems less optimistic. Even if bulls manage to break through the current resistance, another significant horizontal barrier at $0.00001585 remains. Overcoming this resistance is crucial for reversing the current downtrend.
The weekly Stochastic RSI at the chart's bottom indicates a bullish crossover of the lines. If this is confirmed, it could provide the momentum needed for an upward push, hopefully carrying the bulls past the second major resistance.
Disclaimer: This article is provided for informational purposes only. It is not offered or intended to be used as legal, tax, investment, financial, or other advice.
Investment Disclaimer