
Leading Cryptocurrencies on the Rebound: Sui (SUI), Render (RENDER), and Fantom (FTM) Set the Pace
Following three intense days of significant price declines, the market is starting to recover on Friday. Leading the resurgence are Sui (SUI), Render (RENDER), and Fantom (FTM).
$SUI checks all the right boxes
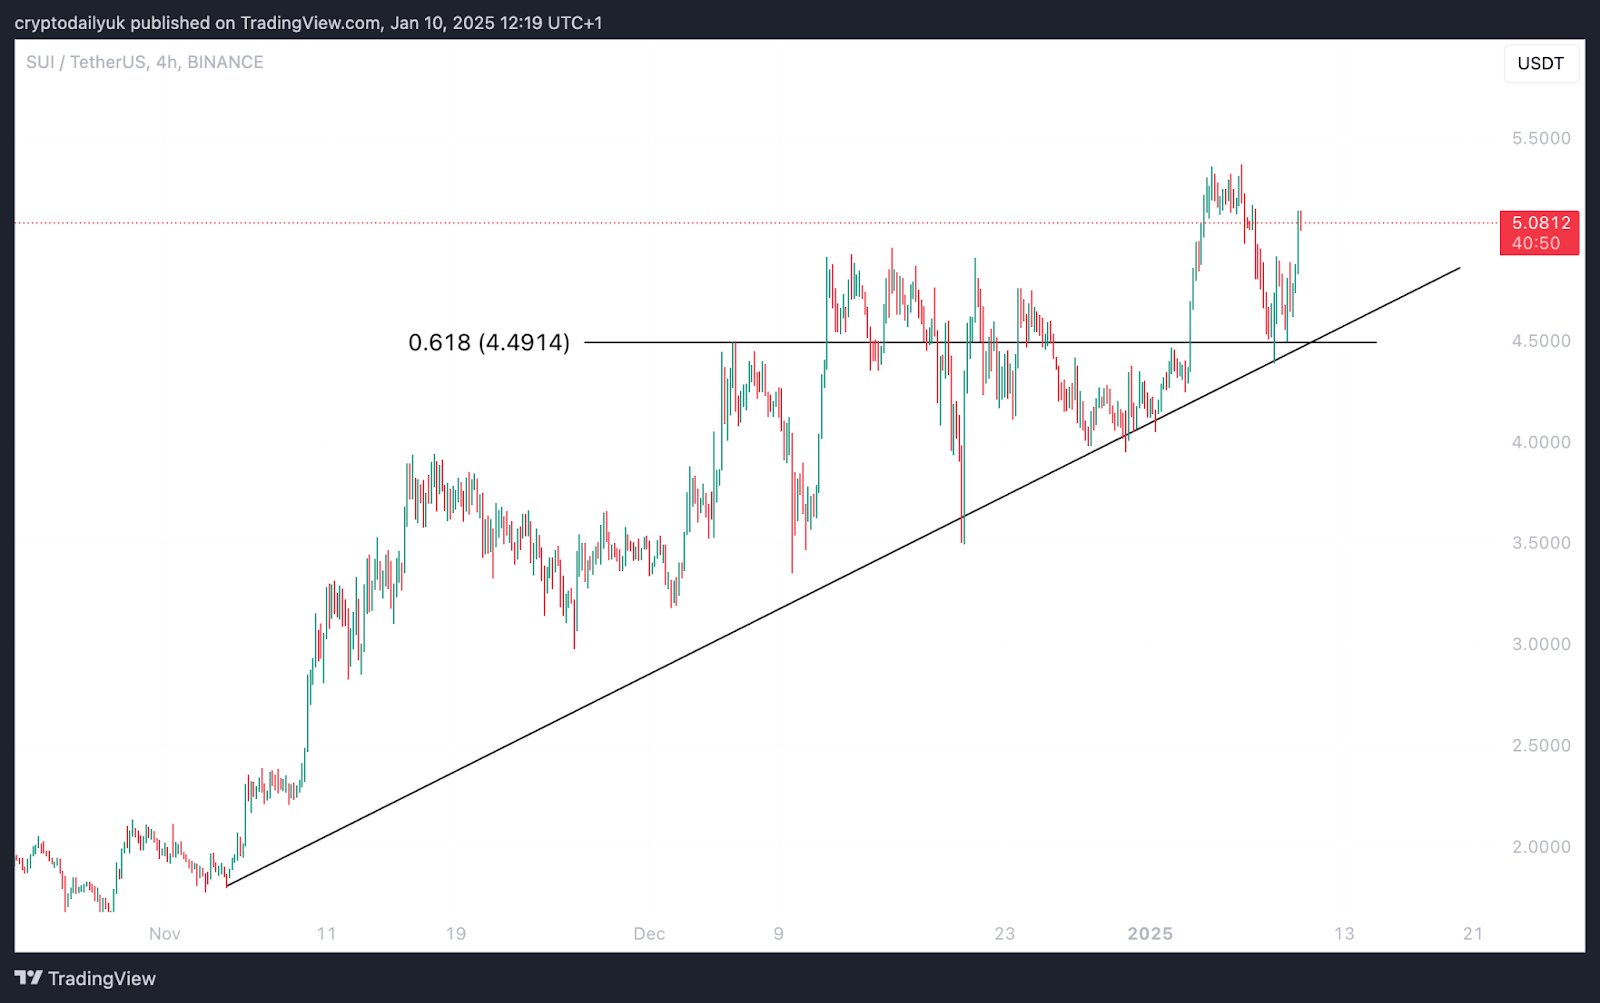
Source: TradingView
Few major cryptocurrencies boast a chart as impressive as $SUI's. The price of $SUI consistently trends upward, showing resilience during bearish periods and outshining others during bullish ones. In the latest downturn, the price dipped to the 0.618 Fibonacci level, while still respecting the upward trendline.
$SUI's remarkable upward momentum
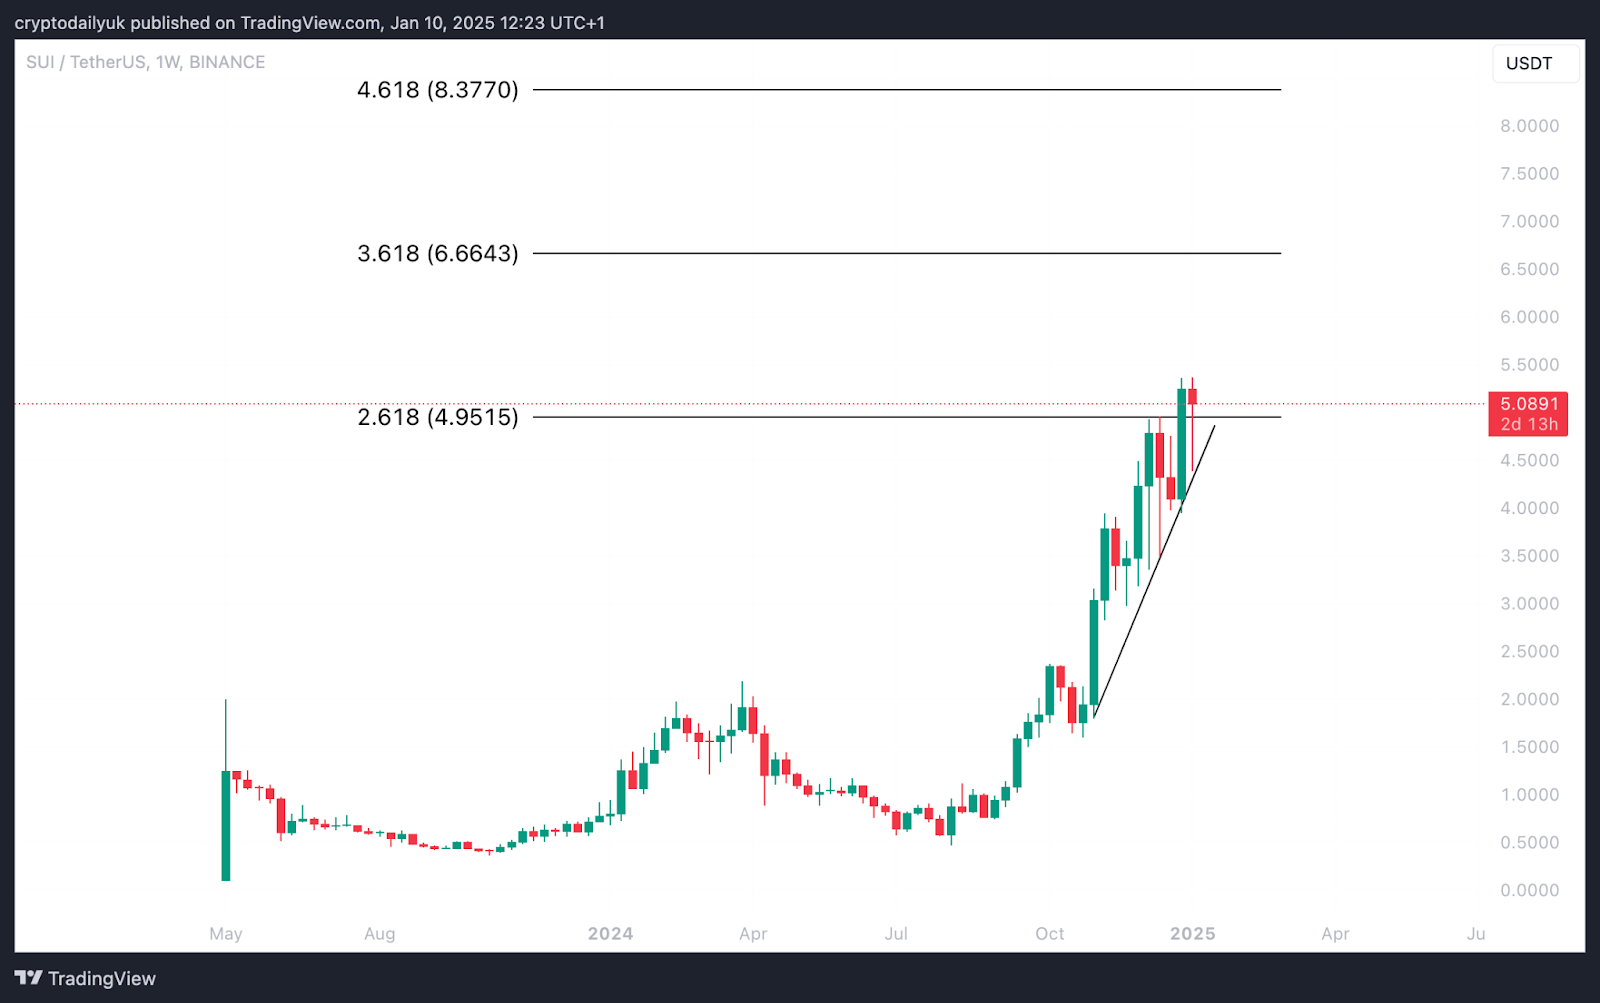
Source: TradingView
The weekly chart for $SUI highlights a spectacular parabolic rise. Holding above the 2.618 level, alongside an impressive weekly candle, underscores the strong buying interest in this premier layer 1 cryptocurrency. The chart outlines further targets.
$RENDER's solid market structure - bullish outlook
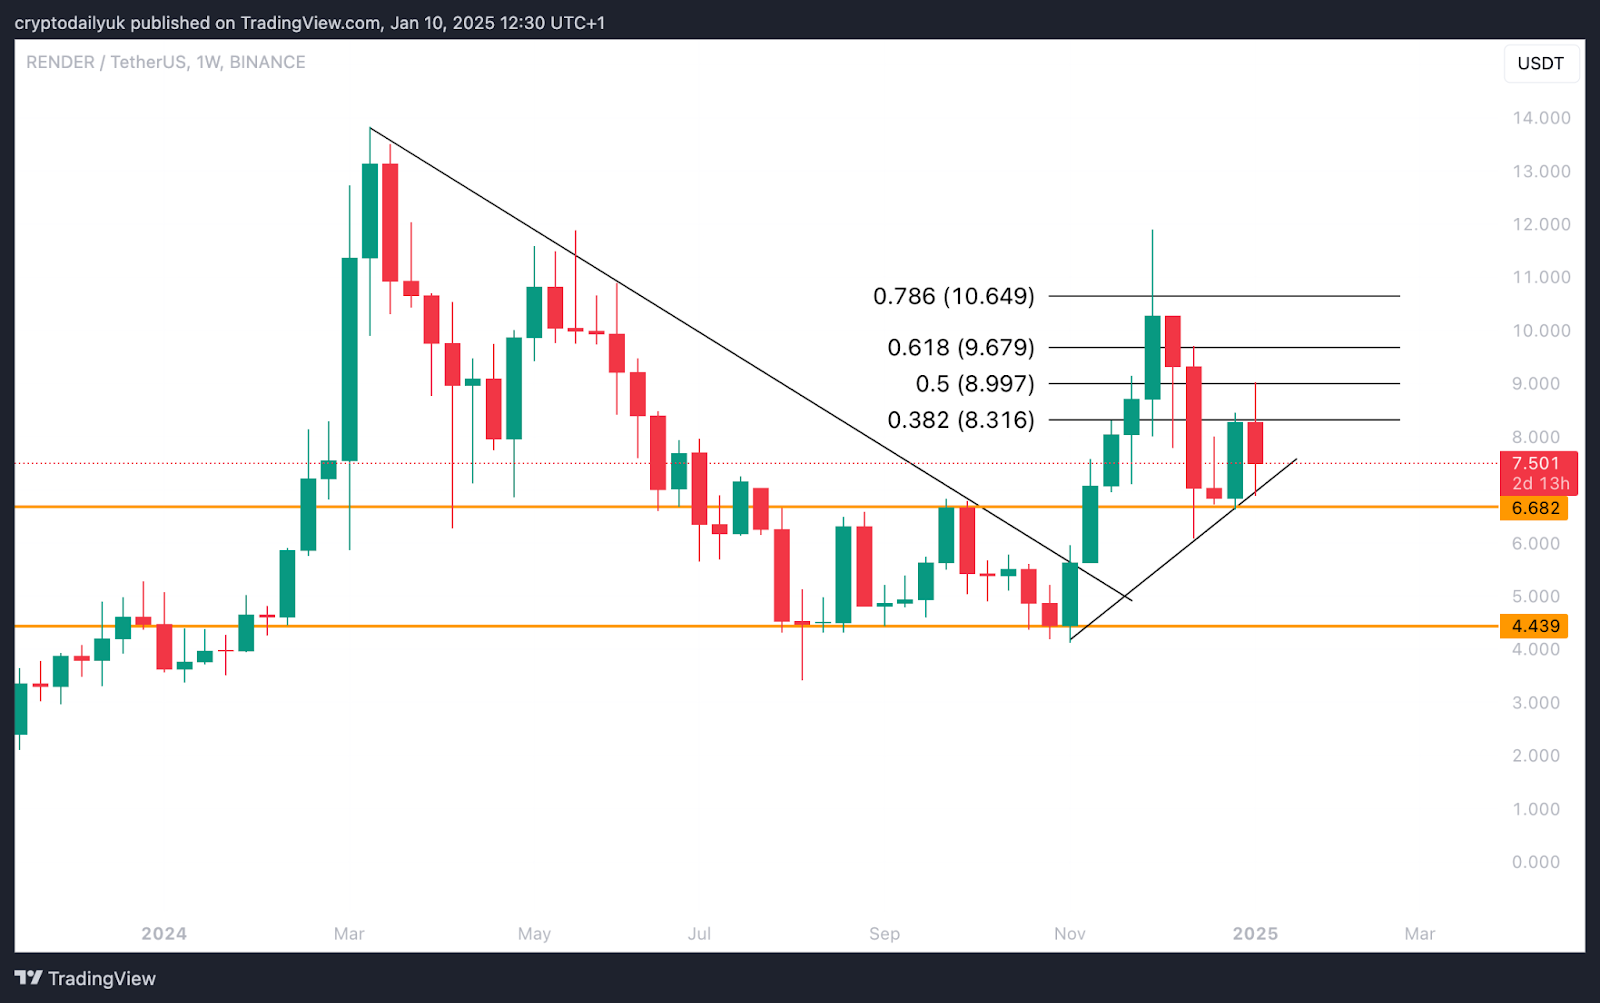
Source: TradingView
The weekly chart for $RENDER is promising. Holding above the crucial $6.68 horizontal support is vital, forming a strong foundational market structure. Had it failed, a decline to $4.44 might have been likely. However, the ascending trendline has held, presenting opportunities for price increases as outlined by Fibonacci levels.
$FTM bulls have more ground to cover
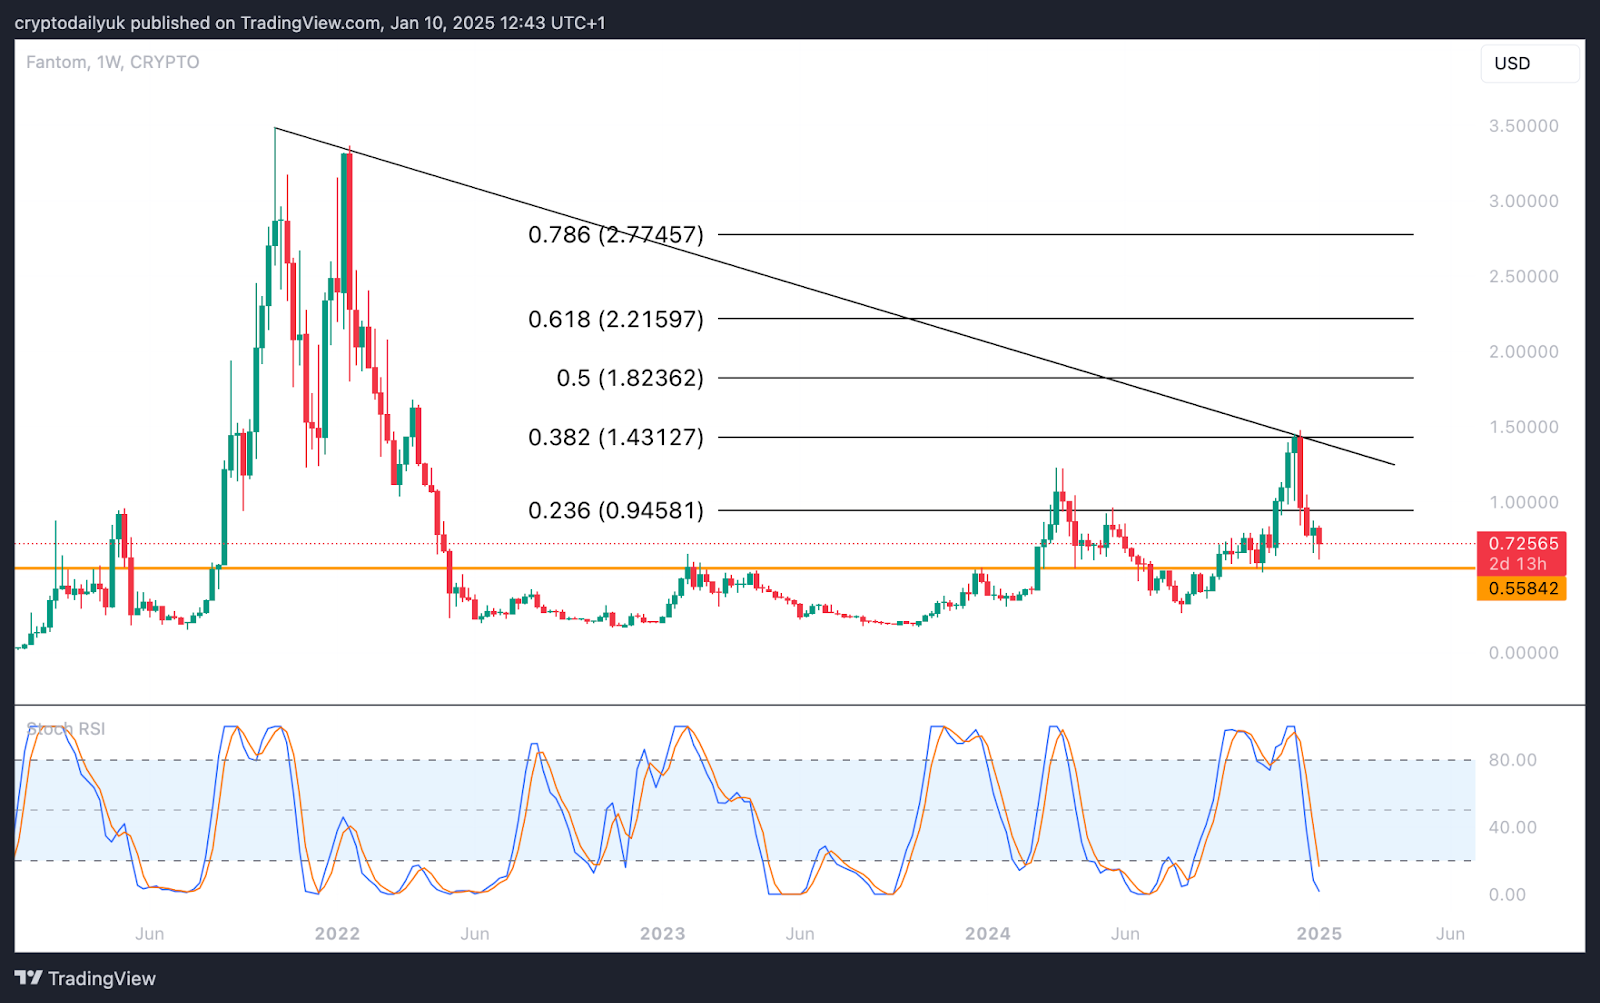
Source: TradingView
$FTM has seen the largest gains on Friday, surging over 12%. However, unlike the other cryptocurrencies, there's still a lot for the bulls to achieve. If the upward trend continues, it could establish a higher low. The bulls would then need to break the descending trendline and achieve a local high to reverse the downtrend. In the final phases of a bull market, this is certainly achievable. The Stochastic RSI at the bottom of the chart appears favorable, as the lines indicate a bottoming process. Once the blue line crosses above the red and both exceed the 20.00 level, it could generate the momentum needed to propel $FTM to a higher local peak.
Disclaimer: This article is provided for informational purposes only. It is not offered or intended to be used as legal, tax, investment, financial, or other advice.
Investment Disclaimer