
Ethereum ($ETH) and Solana ($SOL) vs. Bitcoin ($BTC): Have They Found Their Bottom?
As the crypto bull market approaches its final phase, altcoins are yet to experience the typical explosive "altseason" surge. Bitcoin ($BTC) continues to lead the pack. But have Ethereum ($ETH) and Solana ($SOL) reached their lowest point against their $BTC pairs?
Confirmation of Bitcoin Dominance Breakdown
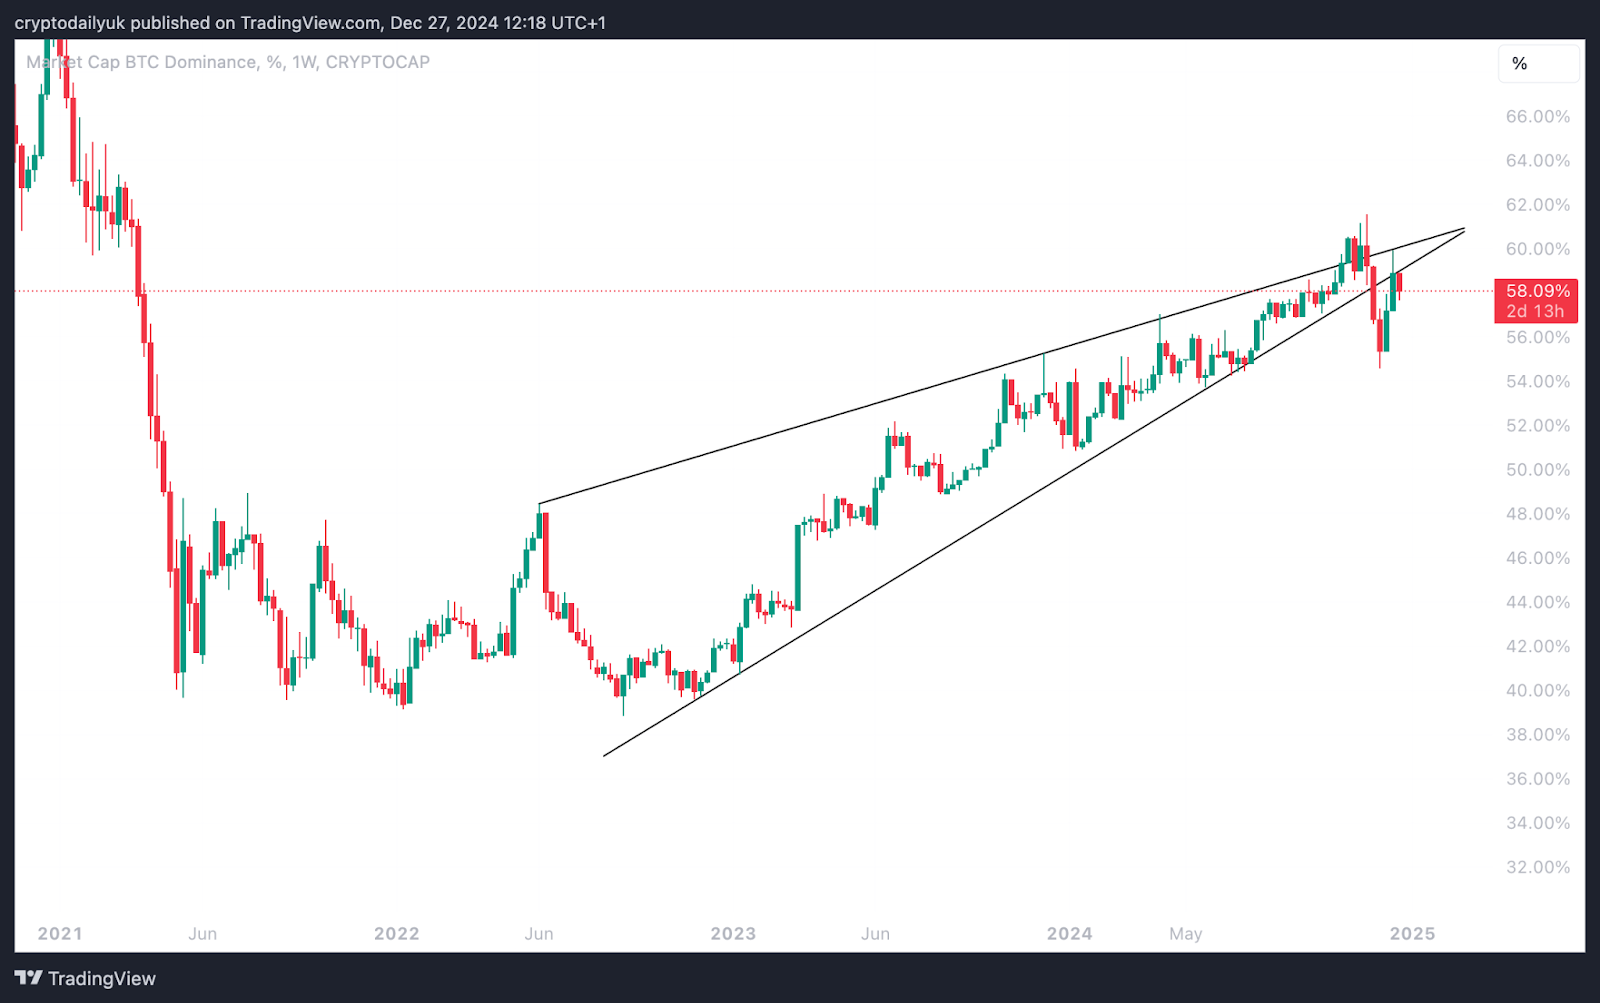
Source: TradingView
The chart that signals the first signs of a significant movement in altcoins is Bitcoin Dominance (BTC.D). An ascending wedge pattern, in development since June 2022, appears to be breaking down. The dominance has slipped beneath the wedge's endpoint, suggesting that the breakdown may be confirmed. Traders and investors might soon be on the lookout for a lower low, driving dominance below 54.6%, with a potential target ranging from 48% down to 40%.
$ETH at Crucial Support Against $BTC
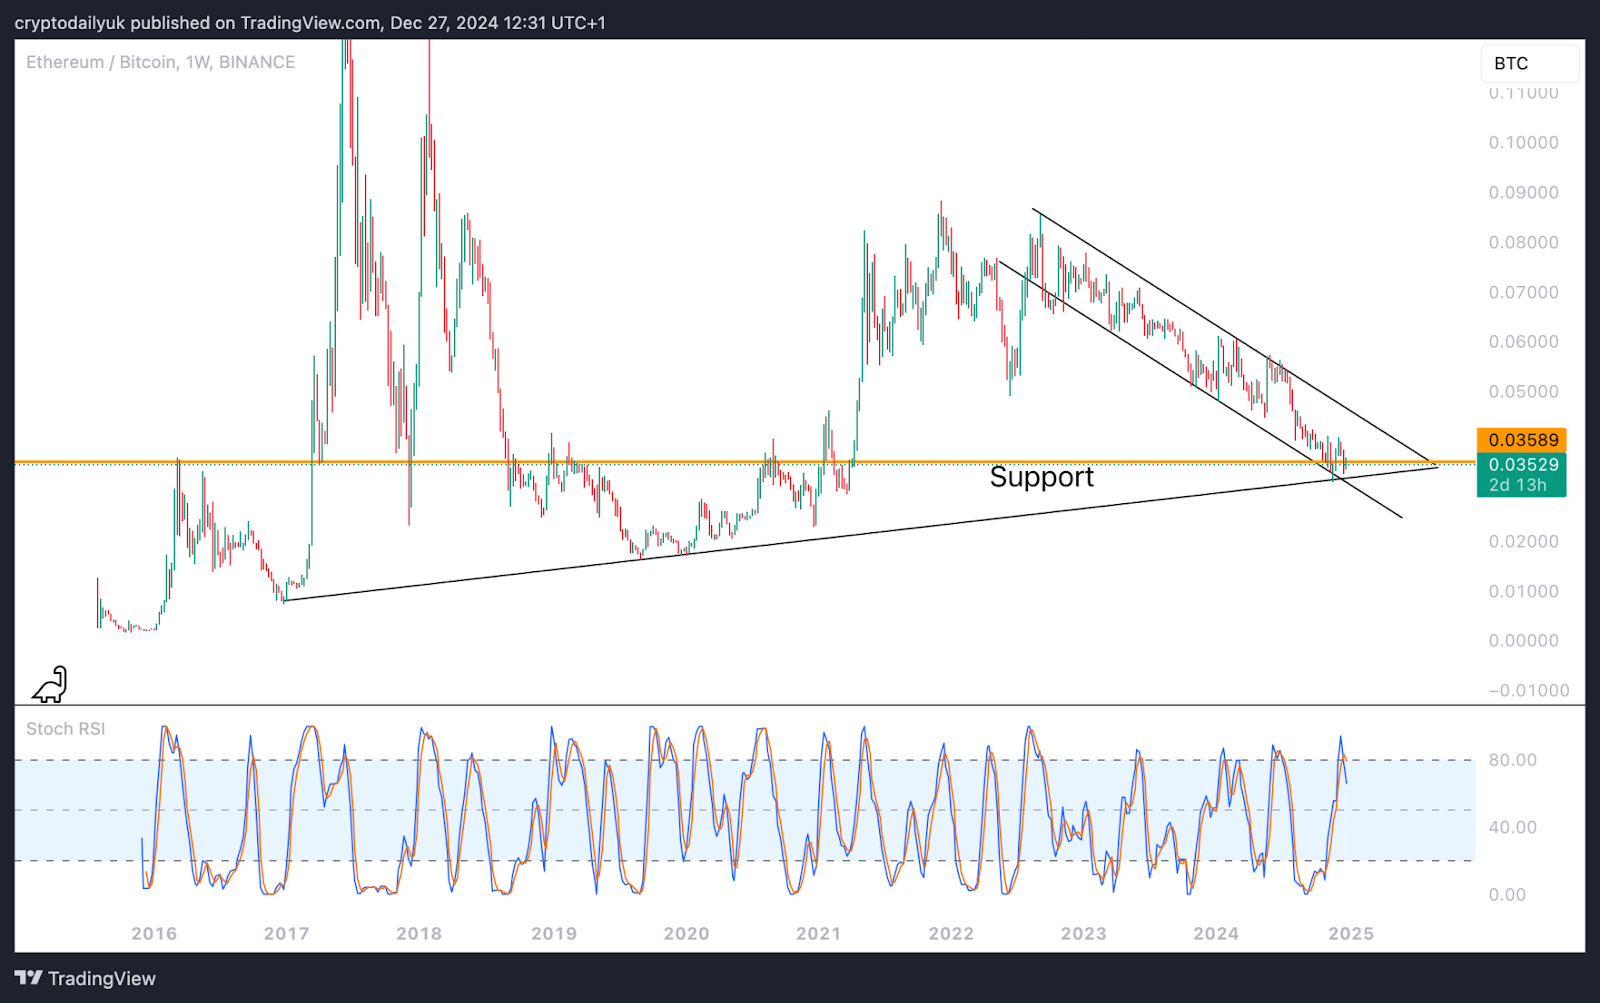
Source: TradingView
$ETH is currently at a vital support level against its $BTC pair (ETH/BTC). A prolonged descending channel has led $ETH to a significant horizontal support at 0.036 BTC. Should this support fail, along with the bull market's rising trendline, it could spell trouble for $ETH—at least until the next bull market cycle begins.
A rebound from this point is essential, given the strength of the support level. However, the Stochastic RSI momentum indicator at the chart's bottom has just shown a downturn. It's highly probable that this line will continue descending, with one final opportunity to bounce at the 50.00 level. This chance must be seized.
$SOL Poised for a Significant Rebound Against $BTC
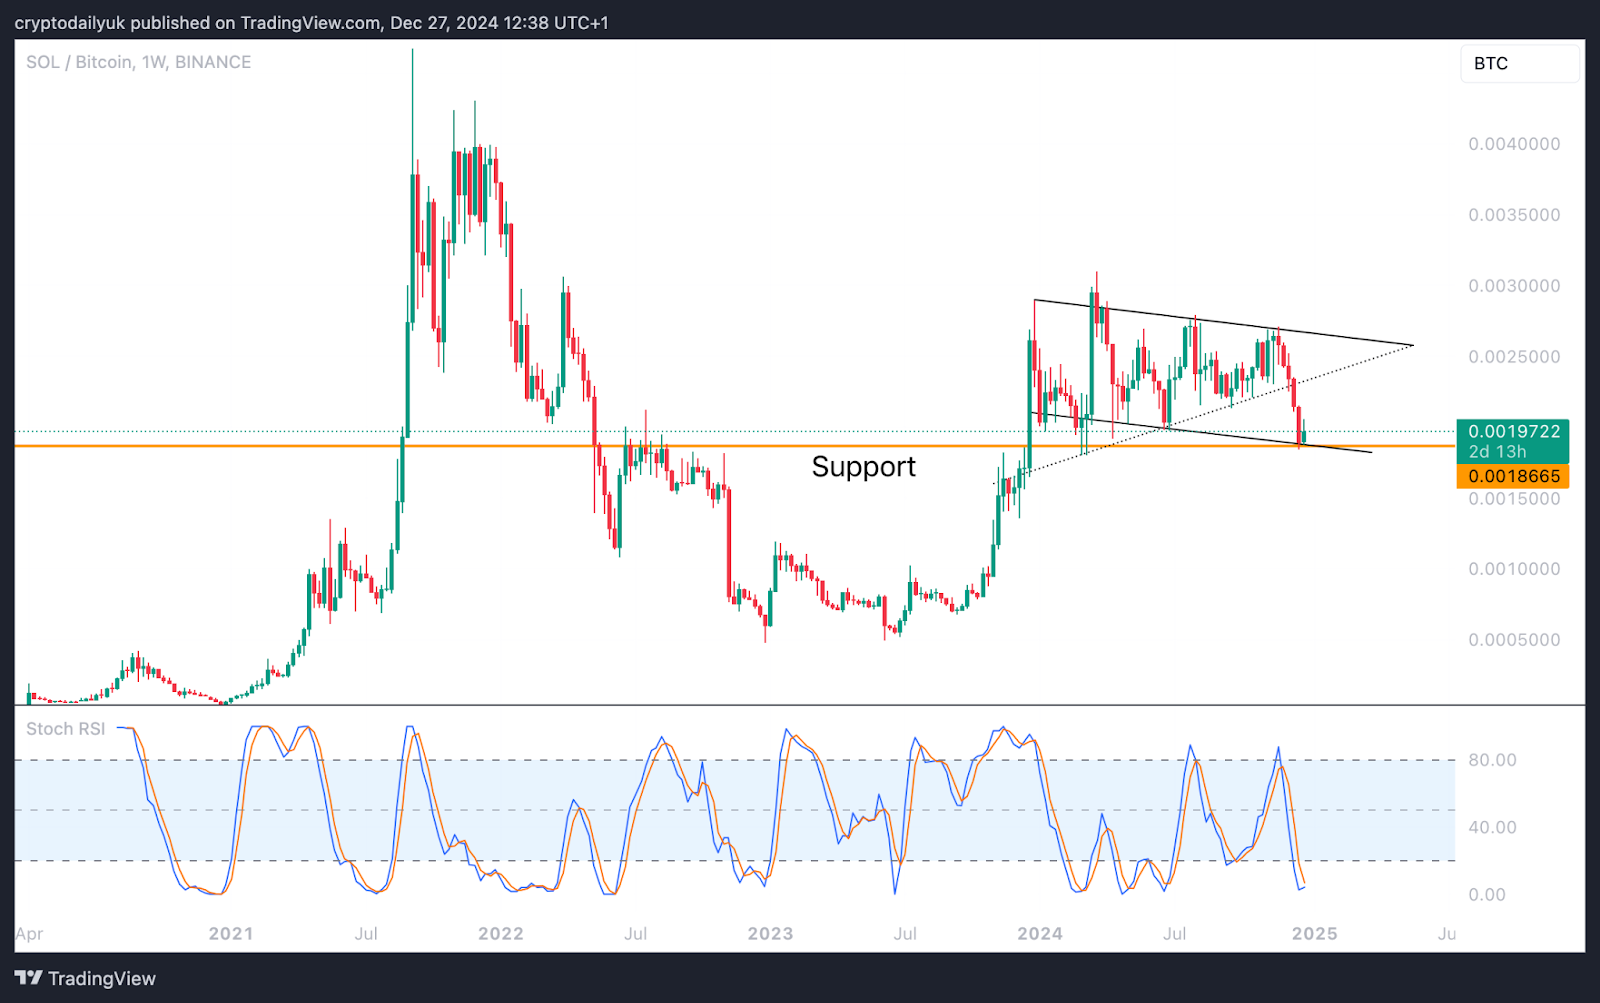
Source: TradingView
The SOL/BTC chart is remarkably optimistic in comparison to ETH/BTC. What initially seemed to be a bullish pennant broke down in early December after failing at its upper trendline. The price continued downward, settling on a critical horizontal support level at 0.00186 BTC.
This area may also represent the base of a bull flag, which implies that a true breakdown hasn't yet occurred. The convergence of the bull flag trendline and the horizontal price support provides substantial backing.
It's anticipated that $SOL will continue to rebound from this point, potentially climbing back to the top of the bull flag and perhaps breaking out to reach new highs.
Additionally, the Stochastic RSI at the chart's bottom supports $SOL. The indicator lines have reached their lowest and are beginning to turn upward, suggesting that momentum for $SOL over $BTC is likely to increase sharply. Keep a close eye on this pairing.
Disclaimer: This article is provided for informational purposes only. It is not offered or intended to be used as legal, tax, investment, financial, or other advice.
Investment Disclaimer