

Picture a Thursday where the biggest AI darlings are red before the bell, futures look wobbly, and by the close the household names are down in double digits with no fresh headlines. The tape feels off. Good companies trade like they posted a profit warning. You can almost see the algorithms dumping baskets into thin bids.
That was the vibe the day the “Magnificent Seven” shed roughly $797 billion of market value in a single session, a rout steep enough to rattle even hardened tech bulls. The question a lot of people asked: is this really fundamentals, or did funds get forced to sell into a weak tape? The short answer is, a lot of it looked like liquidation mechanics doing the talking.
We’re in an AI-led market where capital is concentrated in a handful of semiconductors, platform giants, and model-infrastructure plays. When risk flips, it flips hard because positions, leverage, and signals are correlated. Over the last few weeks, several data points hinted that de-risking wasn’t just discretionary selling — it looked systematic.
When many funds share the same signals and the same crowded names, price becomes the release valve for risk models rather than a reflection of new information.
Goldman’s prime-brokerage desk said hedge funds trimmed U.S. tech exposure by about 10% over roughly two months, the largest exit in more than a decade of their dataset (Briefs.co). Semis were hit especially hard: Reuters noted a fourth straight week of hedge fund selling in hardware and chips into early July as the SOX slid 4.2% that week (Investing.com). A few days later, the PHLX Semiconductor Index confirmed a bear market, down roughly 20% from its June peak (Fidelity). And then came the day the mega caps lost nearly $800 billion in hours (Bloomberg Law).
That’s not just “profit taking.” It’s what forced selling looks like when models, margin, and crowded trades all point in the same direction at once.
How AI-driven funds end up forced to sell
Leverage turns speed into danger
Plenty of funds borrow against equities, or stack exposures through options and swaps. Leverage isn’t inherently bad, but it shortens runway when prices fall. If a concentrated AI basket drops, collateral cushions shrink. Prime brokers mark the book, raise margins, or pull financing limits — and the clock starts ticking.
Volatility targeting and VaR cuts
Risk systems don’t argue. They resize. When volatility spikes, volatility-targeting mandates cut gross exposure. Value-at-Risk shocks can force both net and gross down. Importantly, lots of AI/tech-focused funds use similar inputs and live in similar names. When realized vol jumps or correlations go to one, the models all agree: sell.
Dealer hedging feeds the fire
Options hedging can amplify the move. If funds own calls or sell puts, dealers’ hedges move against the market. On a fast leg lower, dealers sell stock to stay delta-neutral, adding pressure to the same tickers funds are unloading. It’s not manipulation; it’s plumbing.
A typical forced-selling sequence
- Large cap AI names gap lower on a catalyst (earnings miss, guidance nuance) or simply on positioning stress.
- Volatility jumps, VaR breaches hit dashboards, and gross exposure limits kick in.
- Prime brokers adjust margin terms, nudging clients to reduce risk or top up collateral.
- Funds choose the most liquid names to sell first — often the mega caps and semis — because they can move size there.
- Dealer hedging and ETF baskets mechanically add supply as the day progresses.
- Closing auction absorbs a final wave as programs finish VWAP/TWAP schedules, often printing the day’s lows.
None of that requires a change in the 5-year AI narrative. It’s short-horizon risk math colliding with crowded positioning.
Where the selling actually hits the tape
Liquidity windows matter
Forced sellers don’t spray indiscriminately. They try to hide in liquidity. That usually means the open, the close, and index/ETF-linked flows. But if too many programs do that at once, those very windows become the stress points.
| Window/Venue | Typical liquidity | What happens during liquidations |
|---|---|---|
| Market open | Elevated, news-driven | Gappy books; programs dump into thin depth; wide prints set the tone |
| Midday (lit venues) | Lighter, steadier | VWAP/TWAP trickles that grind prices lower; fewer bids show up |
| Dark pools | Block crossing | Discounts widen; blocks clear but reset lit prices when reported |
| Closing auction | Highest of the day | Supply concentrates; final prints overshoot as imbalances flip late |
| ETF primary market | Creations/redemptions | Basket sells propagate to constituents; tracking gaps can appear |
Why baskets magnify the move
Index funds and sector ETFs turn one decision into many trades. If you redeem a semiconductor ETF, authorized participants offload the underlying chips. Add in factor funds de-levering and it looks like everyone hates the same names at once. They don’t; they’re just following mechanical rules.
Auctions as the pressure valve
Because closing auctions are deep, programs target them. On heavy liquidation days, imbalance feeds pile up. A single block on the final print can drag a stock one or two percent lower in seconds, even with no new headlines. It’s not a “tell” on fundamentals; it’s the market finding a clearing price for urgent supply.

Why prices can look “wrong” during liquidations
Liquidity, not value, sets price in the moment
Price discovery gets hijacked by urgency. If 20 funds need out of the same names before their risk teams call again, the marginal trade prints too low. That shows up as temporary dislocations: spreads widen, depth vanishes, and a few aggressive sells dictate the chart.
Correlation “one” drowns out nuance
When models trigger across a complex, everything starts trading like the same asset. Best-in-class chip designers can trade tick for tick with memory suppliers they barely resemble, simply because they sit in the same baskets. Even software or cloud names get dragged because of factor overlap with AI winners.
Options unwind makes it choppier
During a selloff, call positions get trimmed and put protection gets bid. Dealers chase delta and gamma, and intraday swings get sharper. It’s easy to mistake that for new information. Often, it’s just hedging flow sloshing back and forth.
What the latest data says about the AI unwind
Let’s stitch together the breadcrumbs we have. They point to a meaningful, multi-week de-risking wave focused on AI infrastructure and mega-cap tech, with telltale signs of forced selling.
| Date (2026) | Event | Why it matters |
|---|---|---|
| July 6 | Hedge funds dumped chip stocks for a 4th straight week; SOX fell 4.2% that week | Persistent supply in the same pocket; suggests programmatic de-risking (Investing.com) |
| July 17 | SOX confirmed a bear market after a ~20% drop from June | Scale of decline consistent with positioning washout, not a small correction (Fidelity) |
| July 20 | Goldman: tech exposure down ~10% over two months, biggest exit in 10+ years | Record-speed sector de-risking points to rules-based and margin-aware selling (Briefs.co) |
| July 23 | Magnificent Seven lost about $797B of market value in one session | One-day shock that looks like liquidity clearance, not a dozen new red flags (Bloomberg Law) |
Semis carried the brunt
SOX hitting bear-market territory that quickly implies inventory clearing by funds that were overweight AI infrastructure. Those are the names with the most liquidity and the highest notional AUM attached, so they’re the first sold when time is short.
Mega caps became the ATM
When stress hits, managers raise cash where they can. That often means selling the best-performing, most liquid mega caps. The nearly $800 billion one-day drawdown across the top names fits that “use winners to fund survival” playbook.
Record-pace de-risking supports the liquidation lens
If discretionary views had simply turned cautious, you’d expect more staggered rotation and dispersion. Instead, the data points to speed and sameness. That’s the signature of models and margin doing the steering.
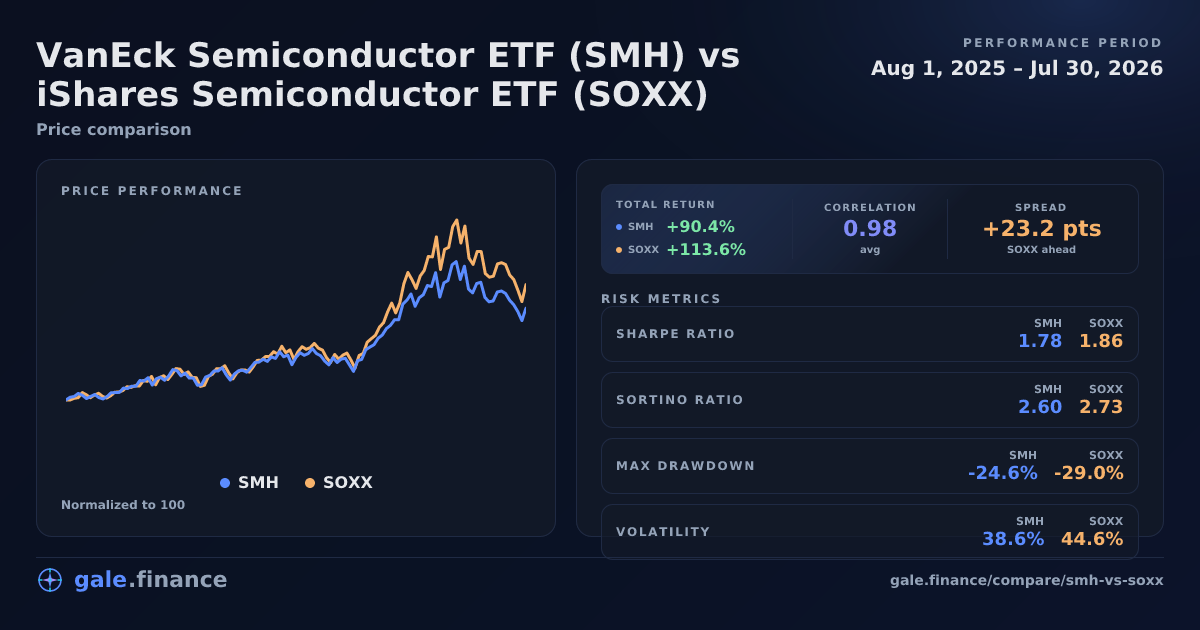
Side-by-side performance chart (SMH vs SOXX) showing the semiconductor ETF drawdown in July 2026 — visual evidence of the chip/AI sector’s sharp sell‑off that amplifies forced‑selling effects on related tech stocks. — Source: Gale Finance
What this means for tech investors and builders
Separate narrative risk from flow risk
Liquidation days blur the line between thesis and tape. If you’re long AI infrastructure for a 3-year buildout, a 4 percent down open followed by an auction air-pocket doesn’t mean your thesis is dead. It likely means someone else’s risk meter is flashing red.
Practical signals to watch
- Imbalance data near the close: repeated sell imbalances in the same tickers hint programs are still exiting.
- Options skew and volume: persistent bid for downside and call unwinds suggest ongoing hedging pressure.
- ETF primary activity: heavy redemptions in semis or AI-factor funds push supply to constituents.
- Prime-broker commentary: when multiple desks flag exposure cuts, assume more to come until vol cools.
- Correlations: if leaders and laggards move in lockstep, it’s flow-led. Real bottoms usually see dispersion return first.
How long can distortions last?
Not forever. Liquidations are finite: positions get smaller, margin calls get met, and VaR normalizes. But they can last longer than feels reasonable, especially if volatility keeps resetting higher and funding costs rise. Watch for stabilization in vol and a tapering of closing-imbalance pressure as early signs the worst is over.
Risks & What Could Go Wrong
- Reacceleration in realized volatility that forces a second round of VaR cuts just as markets stabilize.
- Funding stress: tighter prime-broker terms or higher financing costs that compel additional deleveraging.
- Options feedback loops where dealer hedging exacerbates intraday drops, triggering more risk reductions.
- ETF dislocations if heavy redemptions meet thin liquidity in smaller constituents, widening tracking gaps.
- Macro shocks (rates, geopolitics) that keep correlations high, limiting the chance for dispersion to return.
- Earnings disappointments in key AI suppliers that turn a flow event into a fundamentals reset.
Warning: In forced markets, price can detach from value faster and deeper than most models expect; risk sizing beats conviction until liquidity returns.
Frequently Asked Questions
What exactly counts as forced selling?
Forced selling is when a fund reduces positions because of rules, margin, or mandates rather than a fresh view on value. Think VaR breaches, volatility-targeting cuts, collateral calls from primes, or investor redemptions that must be met by a deadline. The key is urgency: the selling is time-bound, not thesis-driven.
How is this different from normal stop-losses?
A stop-loss is a discretionary tool a PM sets to limit downside on a position. Forced selling often happens across the whole book based on portfolio-level risk metrics or financing terms. With stop-losses, you might cut one stock. With forced selling, you cut baskets and factors, including your winners, to hit gross and net targets.
Why do semiconductors get hit first?
Semis are central to the AI stack and sit inside multiple indices and ETFs. They’re also among the most liquid names in tech, so funds can move size there quickly to meet risk limits. When AI positioning is heavy and time is short, chips become the easiest source of cash.
How can ETFs amplify liquidations?
When investors redeem sector or factor ETFs, authorized participants deliver underlying shares back into the market. If redemptions cluster in semis or AI-growth factors, mechanical selling hits the same constituents funds are already offloading, magnifying pressure.
What signals suggest a liquidation wave is ending?
Look for realized volatility to cool, closing auction imbalances to shrink, and correlations between leaders and laggards to break. Options skew often normalizes as demand for puts eases. Prime-broker notes shifting from “clients are selling” to “clients are rotating” is another tell.
Does this mean AI stocks are mispriced?
During liquidations, yes, prices can deviate from fair value in the short term. But mispricings can cut both ways and may persist if new fundamental data validates lower levels. Treat forced-selling days as flow-driven signals, not proof that the long-term thesis is broken or intact.
Can regulators step in during severe dislocations?
Regulators rarely intervene in routine selloffs. In extreme conditions, exchanges can adjust volatility halts, and brokers may raise margin to reduce systemic risk. Direct bans or trading curbs are uncommon in U.S. equities and tend to be reserved for crises, not sector-specific drawdowns.